The risk of flooding in the continental United States peaks every spring. Experts point to deep snowpack, late winter storms, and rapid melting.
In 2023, springtime floods in California got a lot of media attention. But such risk was universal in most of the forty-eight states south of Canada and north of Mexico.
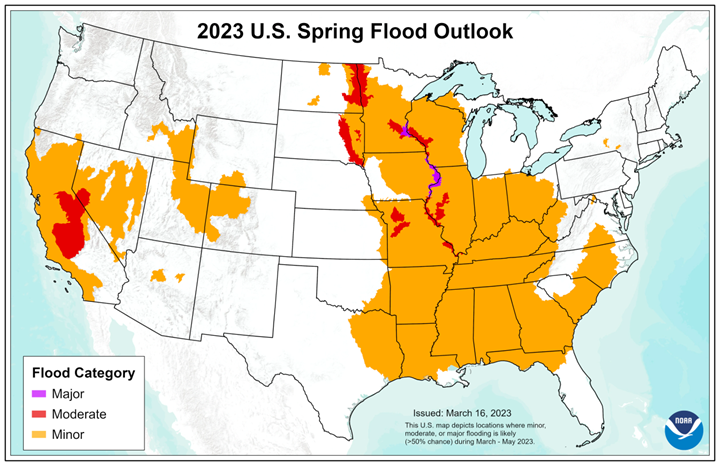
National Weather Service spring flooding estimates in 2023 show that 146 million Americans were at risk, excluding Hawaii and Alaska.
The agency’s risk map predicted flooding across a wide swath of twenty-eight states in mid-America, plus patches in eight mountain and far-western states.
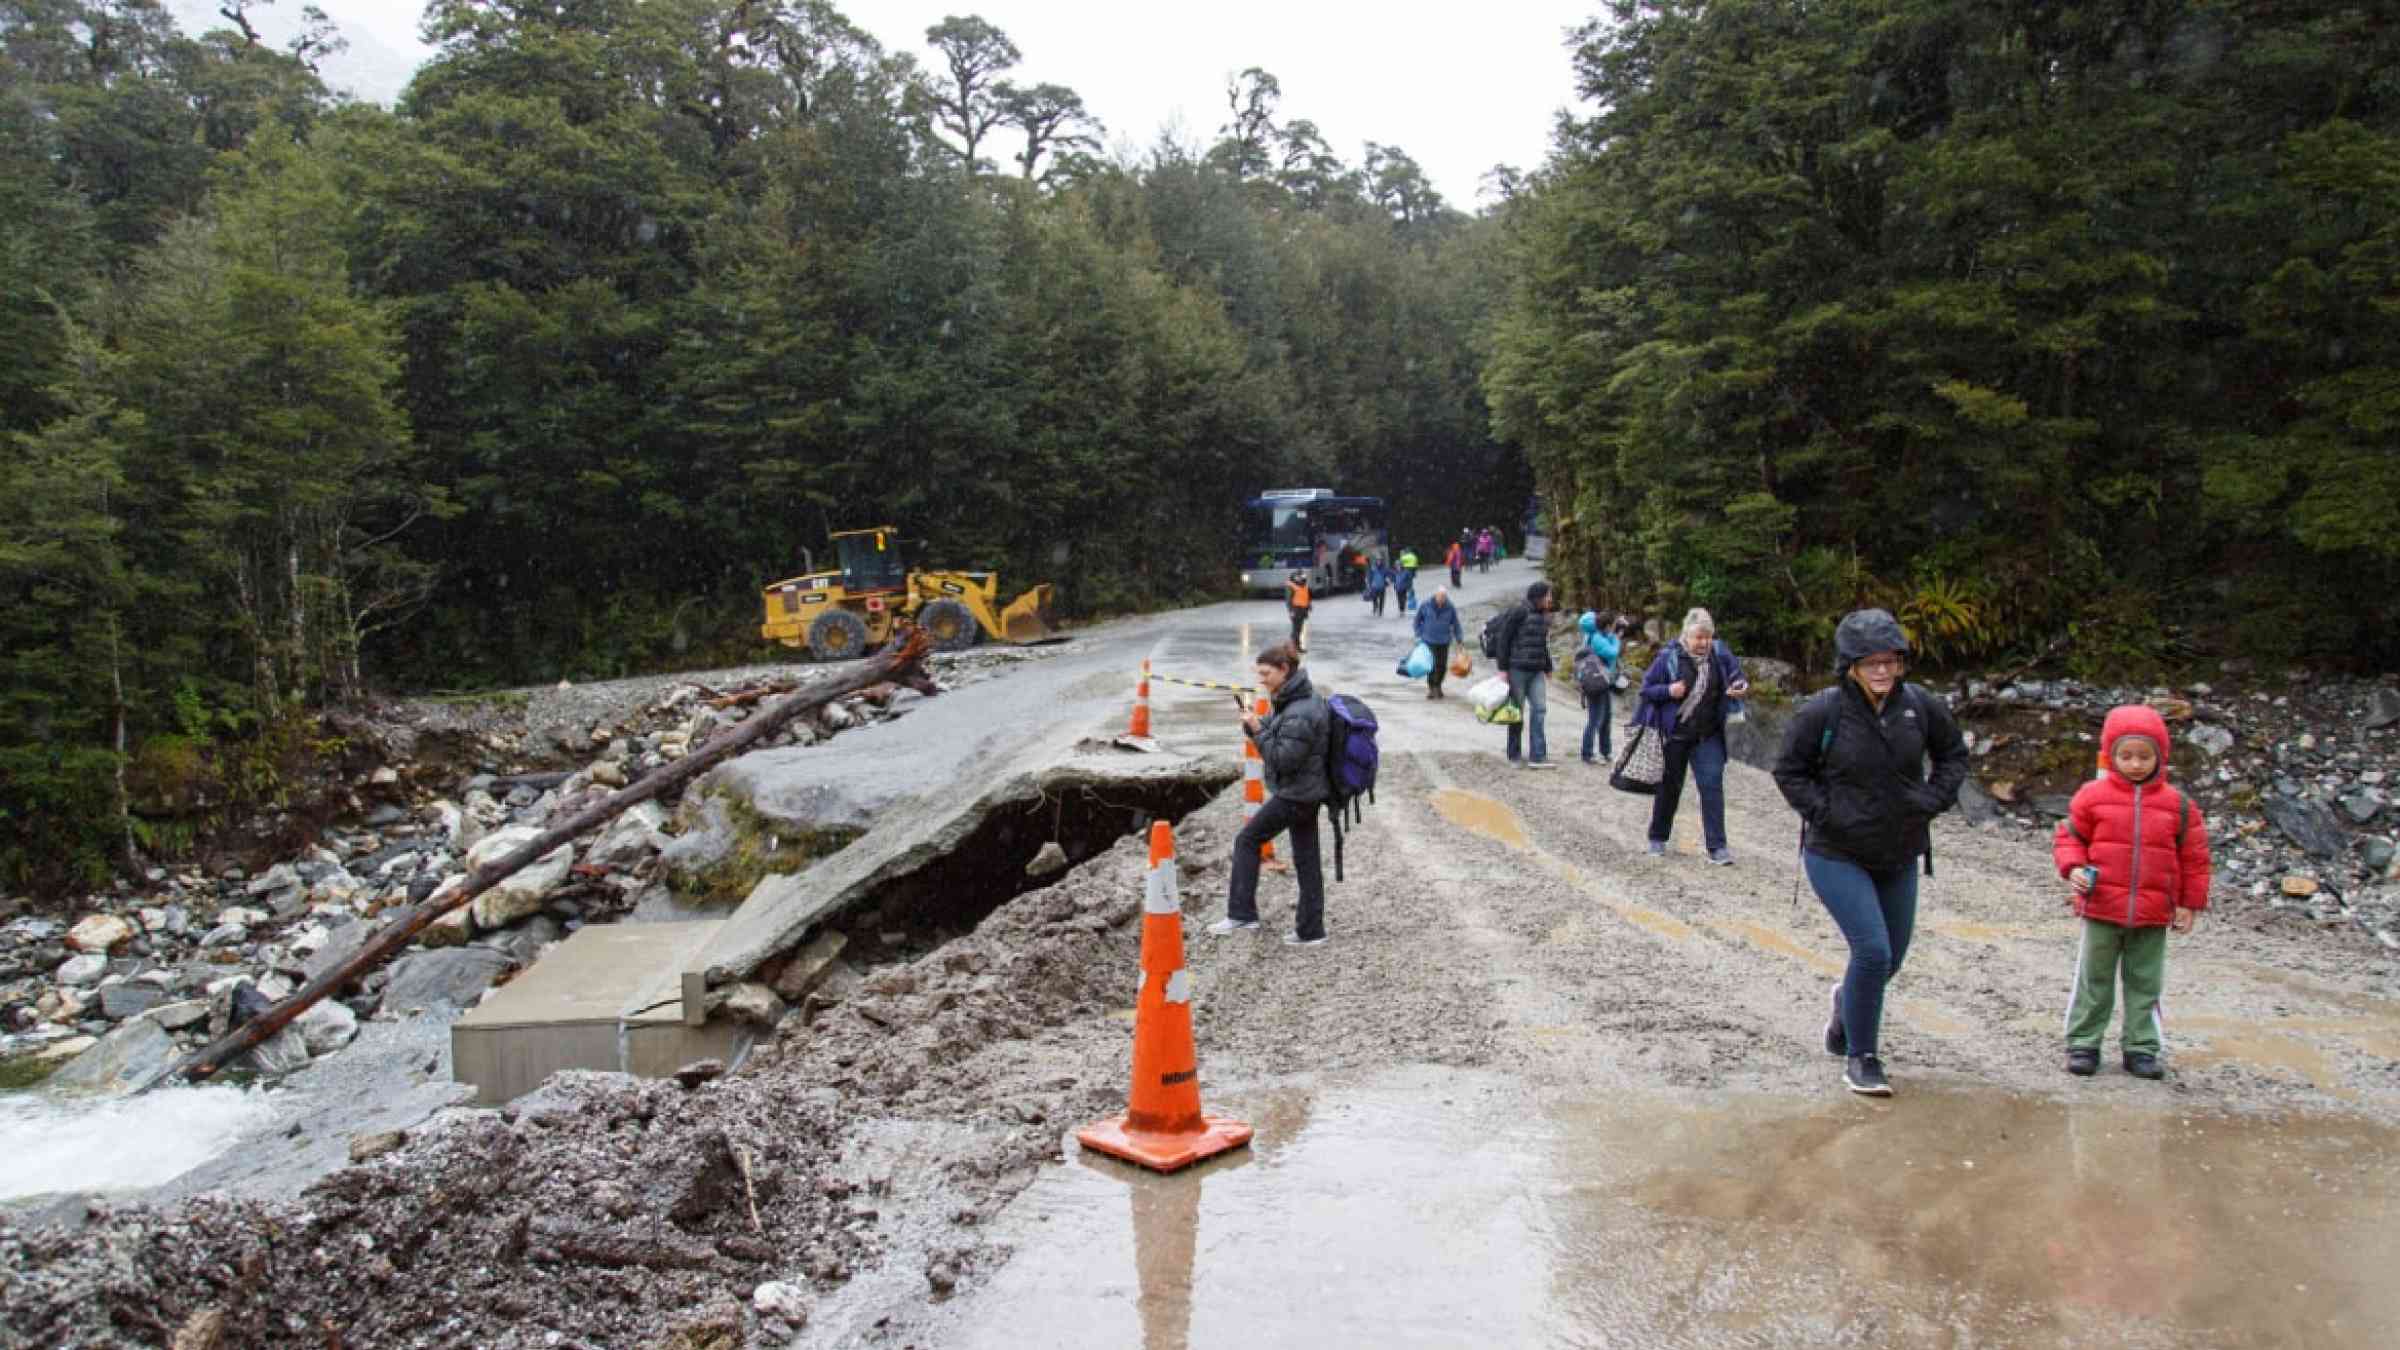
Even small-scale flooding presents risk of injury or death from drowning, electrocution, respiratory illness, and the harms that result from power failures.
A Pacific Northwest National Laboratory (PNNL) team of researchers has developed a new infrastructure design and flood-modeling technique to help anticipate flooding on a local scale.
Adding snow to flood calculations
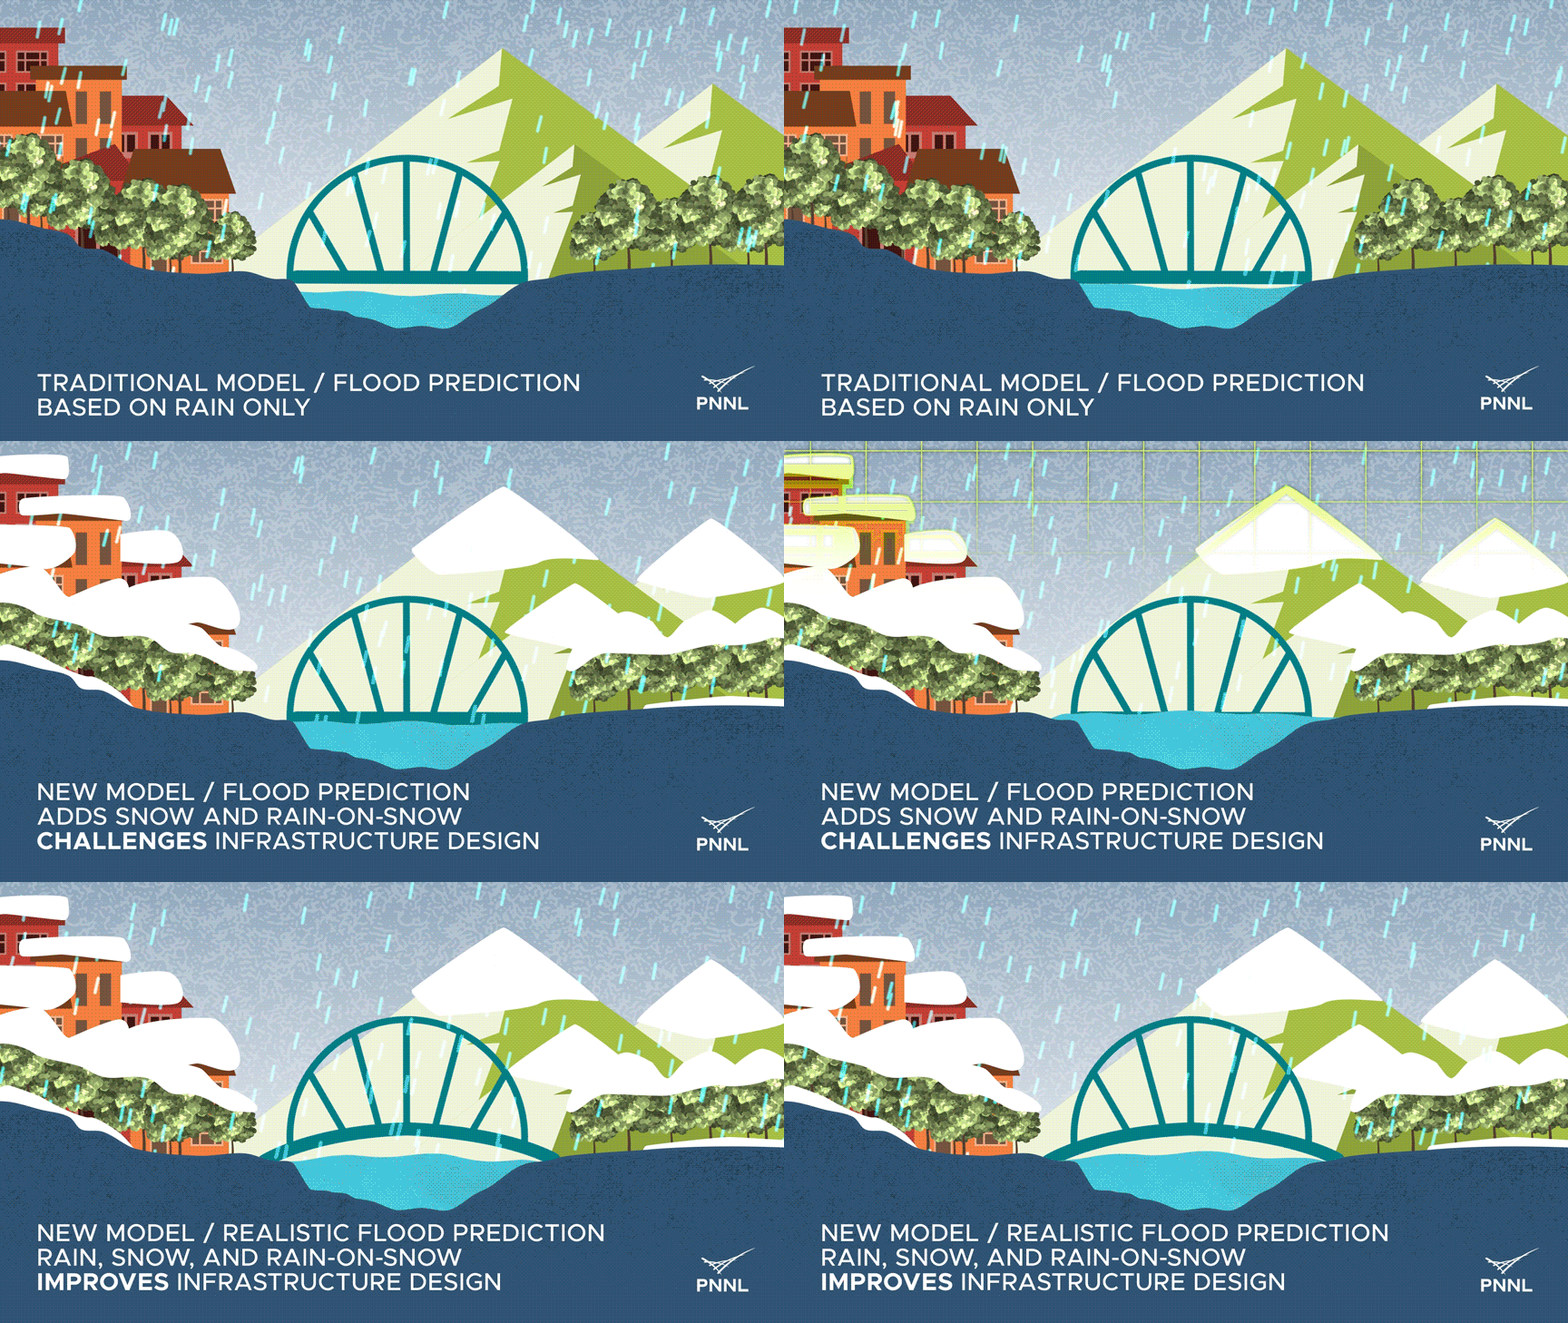
To date, most small-scale engineering solutions for directing the sudden flow of water―catch basins, swales, detention ponds, and the like―are designed based on rain-only events. This decades-old predictive design standard is called―warning: engineering jargon ahead―the precipitation Intensity-Duration-Frequency curves technique.
The new-generation PNNL approach is based on a dataset that takes into consideration not just rain, but also regional snowpack and rain-on-snow events.
To create their dataset, PNNL researchers used more than 200,000 data points derived from rain and snow predictions nationwide. The data are based on simulation grids a little less than 4 square miles each.
“What makes our approach unique,” said Ning Sun, a PNNL hydrologist, “is that it can provide the exact time and magnitude of snowmelt at different locations.”

‘Simple, elegant, and useful’
Mark Wigmosta, a PNNL chief scientist, conceived of the project in 2017. Since then, he has joined Sun and PNNL surface water hydrologist Hongxiang Yan in writing a nine-paper series of studies that tell the tale of the approach’s evolution.
These include a proof-of-concept study (2018), an introduction of the idea to engineering communities (2019), and the first paper to validate the new method (2019).
Interest was immediate. A 2018 commentary in Water Resources Research called the PNNL approach “simple, elegant, and useful.”
The team’s most recent paper appeared in April 2022. It demonstrates that PNNL datasets show how much water reaches the land surface because of distinct contributions from rain, snowmelt, and rain-on-snow events.
Next: land-cover data
The team is working on the next evolution of the approach, which will incorporate eight new categories of land use and land cover. Original datasets in their new-generation approach are based on “open-area” land cover―that is, an imagined surface with minimal vegetation.
“Vegetation canopy intercepts some snowfall, which impacts the timing and final amount of water that reaches the land surface,” said Wigmosta. “It’s important to pre-calculate curves for all these variables.”
Even more dense and more comprehensive datasets are part of future versions of the approach, said Yan. “We have more datasets, more mature datasets, and we have done more theoretical work.”
The PNNL framework has matured beyond its original 2018 data, which represented only 376 western U.S. observation sites. The current dataset represents more than 200,000 sites. Soon there will be millions, thanks to simulations based on added vegetation cover.

Defense department beginnings
The PNNL project set out to optimize water-control infrastructure at military bases. These critical defense operations are about the size of small towns.
Funders from the U.S. Department of Defense are the Strategic and Environmental Research and Development Program and the Environmental Security Technology Certification Program. The initial focus was on proof-of-concept. Now it’s on application and outreach.
The PNNL research uses the 327,000-acre U.S. Army Yakima Training Center in eastern Washington State as a test case. The resulting infrastructure design approach will soon benefit civilian communities that operate hydrologic infrastructure at a similar scale.
“We want to get these datasets out,” said Wigmosta.
Using the web tool
For now, the PNNL scheme is available only for beta testing by defense authorities. However, the PNNL team has developed a web tool through Amazon Web Services. It will be available to a wider community of water engineers later in 2023.
“The (PNNL) dataset is the engine behind the web tool,” said Yan. “At the back end, there is a sophisticated model, but you don’t have to learn how to use it.”
A local water engineer would simply fill in fields related to location, vegetative cover, forest type, the desired time scale (24, 48, or 72 hours), and other factors. In return, the engineer would get estimates of runoff intensity at any location of interest.
Meanwhile, “we can update the web tool and use it as a way of running our model,” said Wigmosta. “We can advance the state of the science, regenerate all those (intensity, duration, and frequency) curves, and get them out publicly.”
Soon: climate change considerations
The web tool and the expanded datasets are ready, said Yan. “Now we can consider the future.”
To do that, the PNNL team is collaborating with the National Center for Atmospheric Research in Colorado to add climate change data into an even newer version of the scheme.
In time, the researchers also aspire to create even finer resolutions of scale available to users―from the present 4 square miles or so to an area one-sixth as big―about the size of a big city park or a college campus.
Finer resolutions and more accurate flood models are important in a warming world. Experts anticipate a future of more rain-on-snow events at higher elevations, intensified storms, and greater flood risks.
To improve small-scale hydrologic infrastructure, the PNNL approach will evolve to be even more comprehensive and useful, said Yan. “We want to move forward.”