Extreme wildfire conditions in Canada have been fueled by intense, spatially extensive and persistent fire-conducive weather conditions, known as fire weather, which has been observed since the beginning of May throughout the country. Canada has experienced its warmest May-June period since 1940, beating the previous record set in 1998 by a huge margin (0.8°C). At the national scale, relative humidity was also very low. The warm and dry conditions, together with continuous southeasterly winds fueled extensive fire spread in Alberta, British Columbia, central Saskatchewan and southwestern portions of the Northwest Territories.
There are at least 17 direct fatalities linked to the fires, more than 150,000 people have been evacuated, and at least 200 structures, including homes, were damaged in the fires (AP News, 2023). The Canadian wildfires have severely impacted air quality locally in Canada, and in the neighbouring United States with Air Quality Index (AQI) values frequently exceeding safe levels in the midwest and northeast USA, and in some cases approaching record levels (e.g. on June 7th AQI reached 341 in New York City, considered hazardous for all residents) (CNBC, 2023). Similarly, in southern Ontario, including the cities of Ottawa and Toronto, air quality reached the “very high risk” level forcing officials to cancel public events and reduce hours for outdoor public services. Schools remained closed for several days in many states, including Nova Scotia, New York, New Jersey, and Connecticut.
In this study we focus on the fires in eastern Canada, which experienced a particularly unusually active fire season in 2023 and are most directly linked with the very large-scale impacts on air quality. In order to identify the role of human-induced climate change we focus on fire-weather indices rather than on fire regime variables such as area burned, in order to identify whether and to what extent climate change altered fire-prone weather conditions.
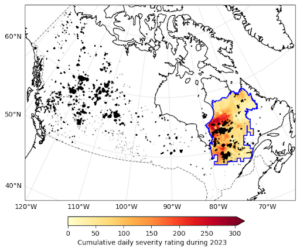
To capture the extent and duration of the extreme fire weather across the region, we will use the cumulative daily severity rating (Figure 1). The DSR is a scaled power transformation of the Canadian Fire Weather Index (FWI), and reflects how difficult a fire is to suppress once ignition has occurred; it is commonly used for assessing fire weather on monthly or longer timescales (Van Wagner,, 1987). To capture the peak intensity of the fire season, we also take the annual maximum of the 7-day moving average of the FWI. This index has been used in previous attribution studies (eg. van Oldenborgh et al., 2021), where it has been found to have a good correlation with the area burned.
