Forensic analysis reveals the causes of building damage in İzmir in the Oct. 30 Aegean Sea earthquake

By Mustafa Erdik, Mine B. Demircioğlu and Cüneyt Tüzün
Summary
On Oct. 30, 2020, the eastern Aegean was rattled by a magnitude-7.0 earthquake. The city of İzmir, 40 miles (65 kilometers) from the epicenter, suffered disproportionately in the event. 115 lives were lost and about 4% of the city’s buildings were affected — six collapsing completely. The cause for these losses appears to stem from three elements: strong amplification of shaking throughout the basin in which Izmir sits, poor code compliance and inadequate construction inspections that prevailed in the 1990’s when many of these heavily damaged and collapsed buildings were constructed.
Nevertheless, a comprehensive analysis of İzmir’s seismic hazard and risk carried out with serendipitous foresight by the United Nations Secretariat of the International Decade for Natural Disaster Reduction in 1996, and a dense network of ground motion sensors in Turkey, have together made these forensic insights possible. More than anything else, they point to İzmir’s vulnerability to future large shocks on the active faults that bound this vibrant city. Enhancing the assessments of the likely ground motion in future earthquakes for the code-compliant design of the next generation of tall buildings, and retrofitting or removing buildings at risk of a future heavy damage, would be a great step forward.
Technical article
A magnitude Mw7.0 earthquake struck offshore, about 13 km to the north of Samos Island (Greece) and to about 15 km South of the Turkish coast, in the eastern Aegean Sea on Oct. 30 2020 (Figure 1). Although many buildings were damaged or collapsed and two lives were lost as a result of the earthquake in Karlovasi-Samos Island, Greece, the city of İzmir (Turkey), located about 65 km to the N-NE of the earthquake epicenter, was rather heavily affected by the earthquake, with hundreds of buildings either damaged or collapsed and 115 lives lost. Whereas Karlovasi is a small city with a population of about 10,000, İzmir is the third largest city in Turkey with a provincial population of 4.3 million. Why was Izmir seemingly so much more strongly affected?

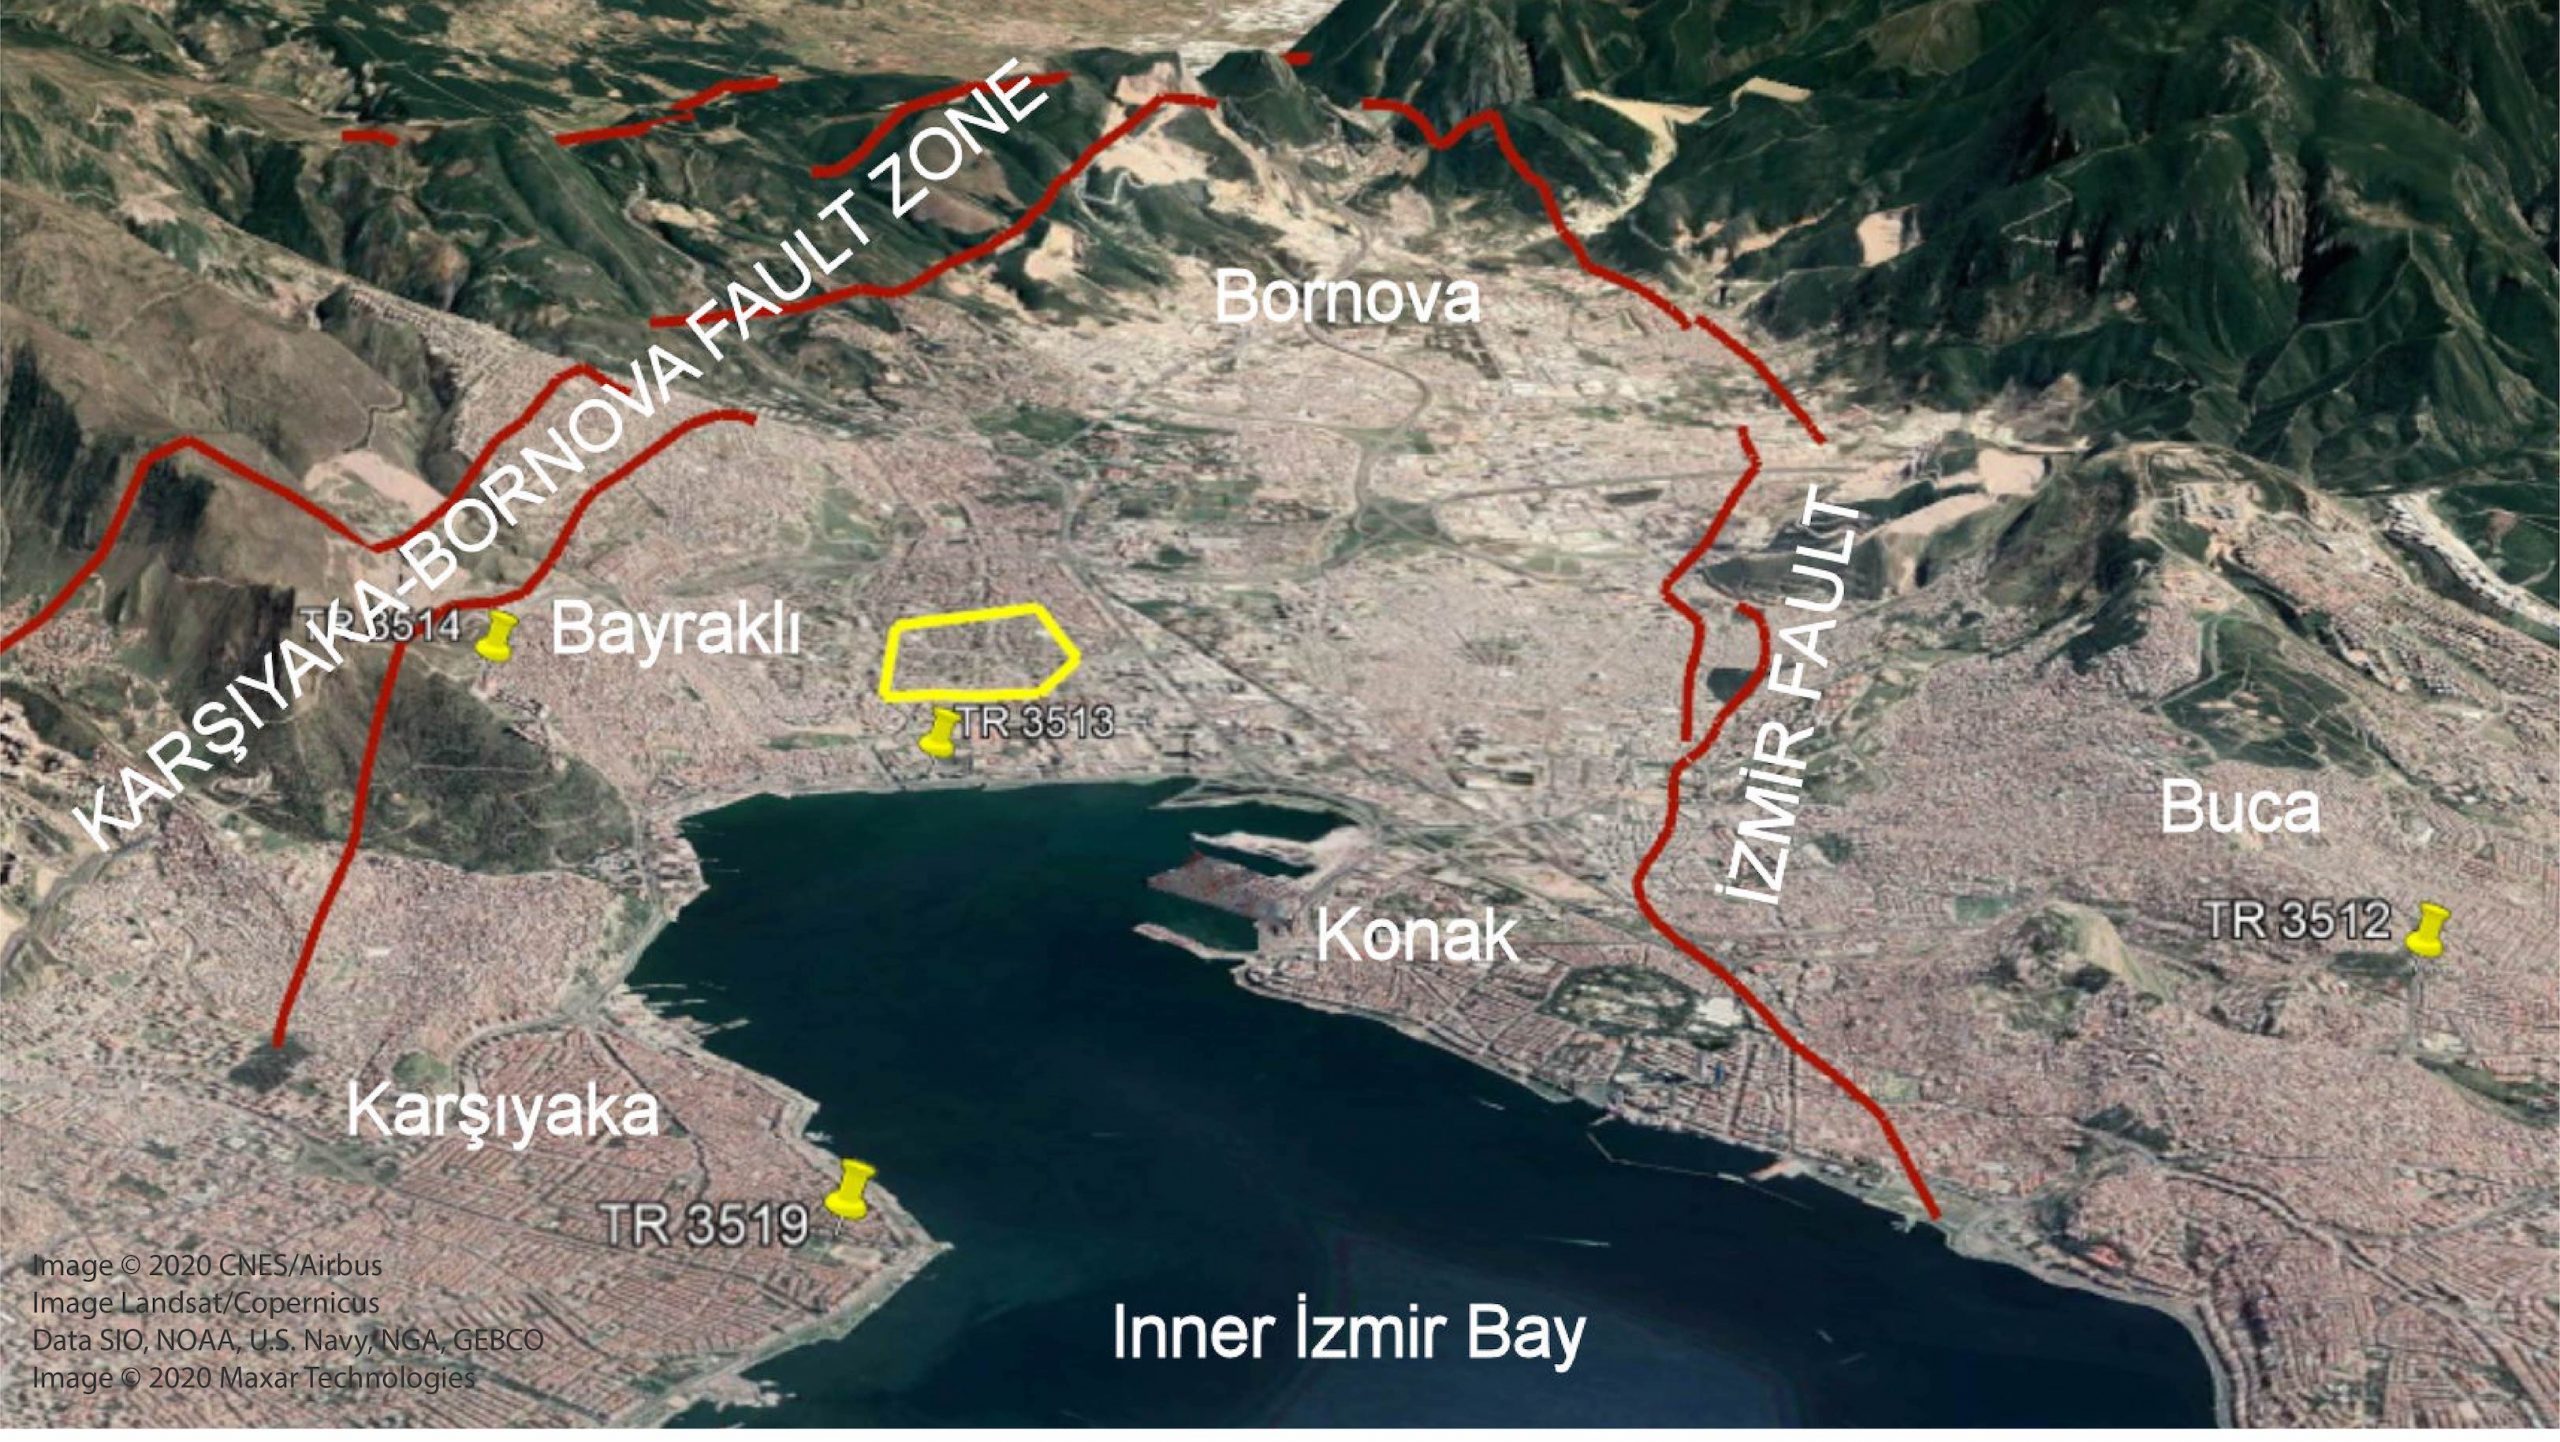
Figure 1. The location of stations (yellow pins in right image) and mainshock (red star in left image).
The city of İzmir is located around the Inner İzmir Bay (Figure 1). Inner İzmir Bay is an actively growing shallow marine basin controlled by active E-W trending extensional (‘normal’) faults in the Aegean Extensional Province (Figure 2 after Uzel et. al, 2012). The young (Holocene) alluvium and fan-delta to shallow marine deposits, confined and controlled by the İzmir Fault to the south and the Karşıyaka-Bornova fault to the north, constitute the uppermost sediments in the basin (Figures 2 and 3). The fault lines indicated on Figures 1 and 3 are taken from the fault maps prepared by the General Directorate of Mineral Research and Exploration. The soft sediments and basin structure itself played a large role in amplifying the shaking.


About 4% of Izmir’s buildings were affected by the earthquake
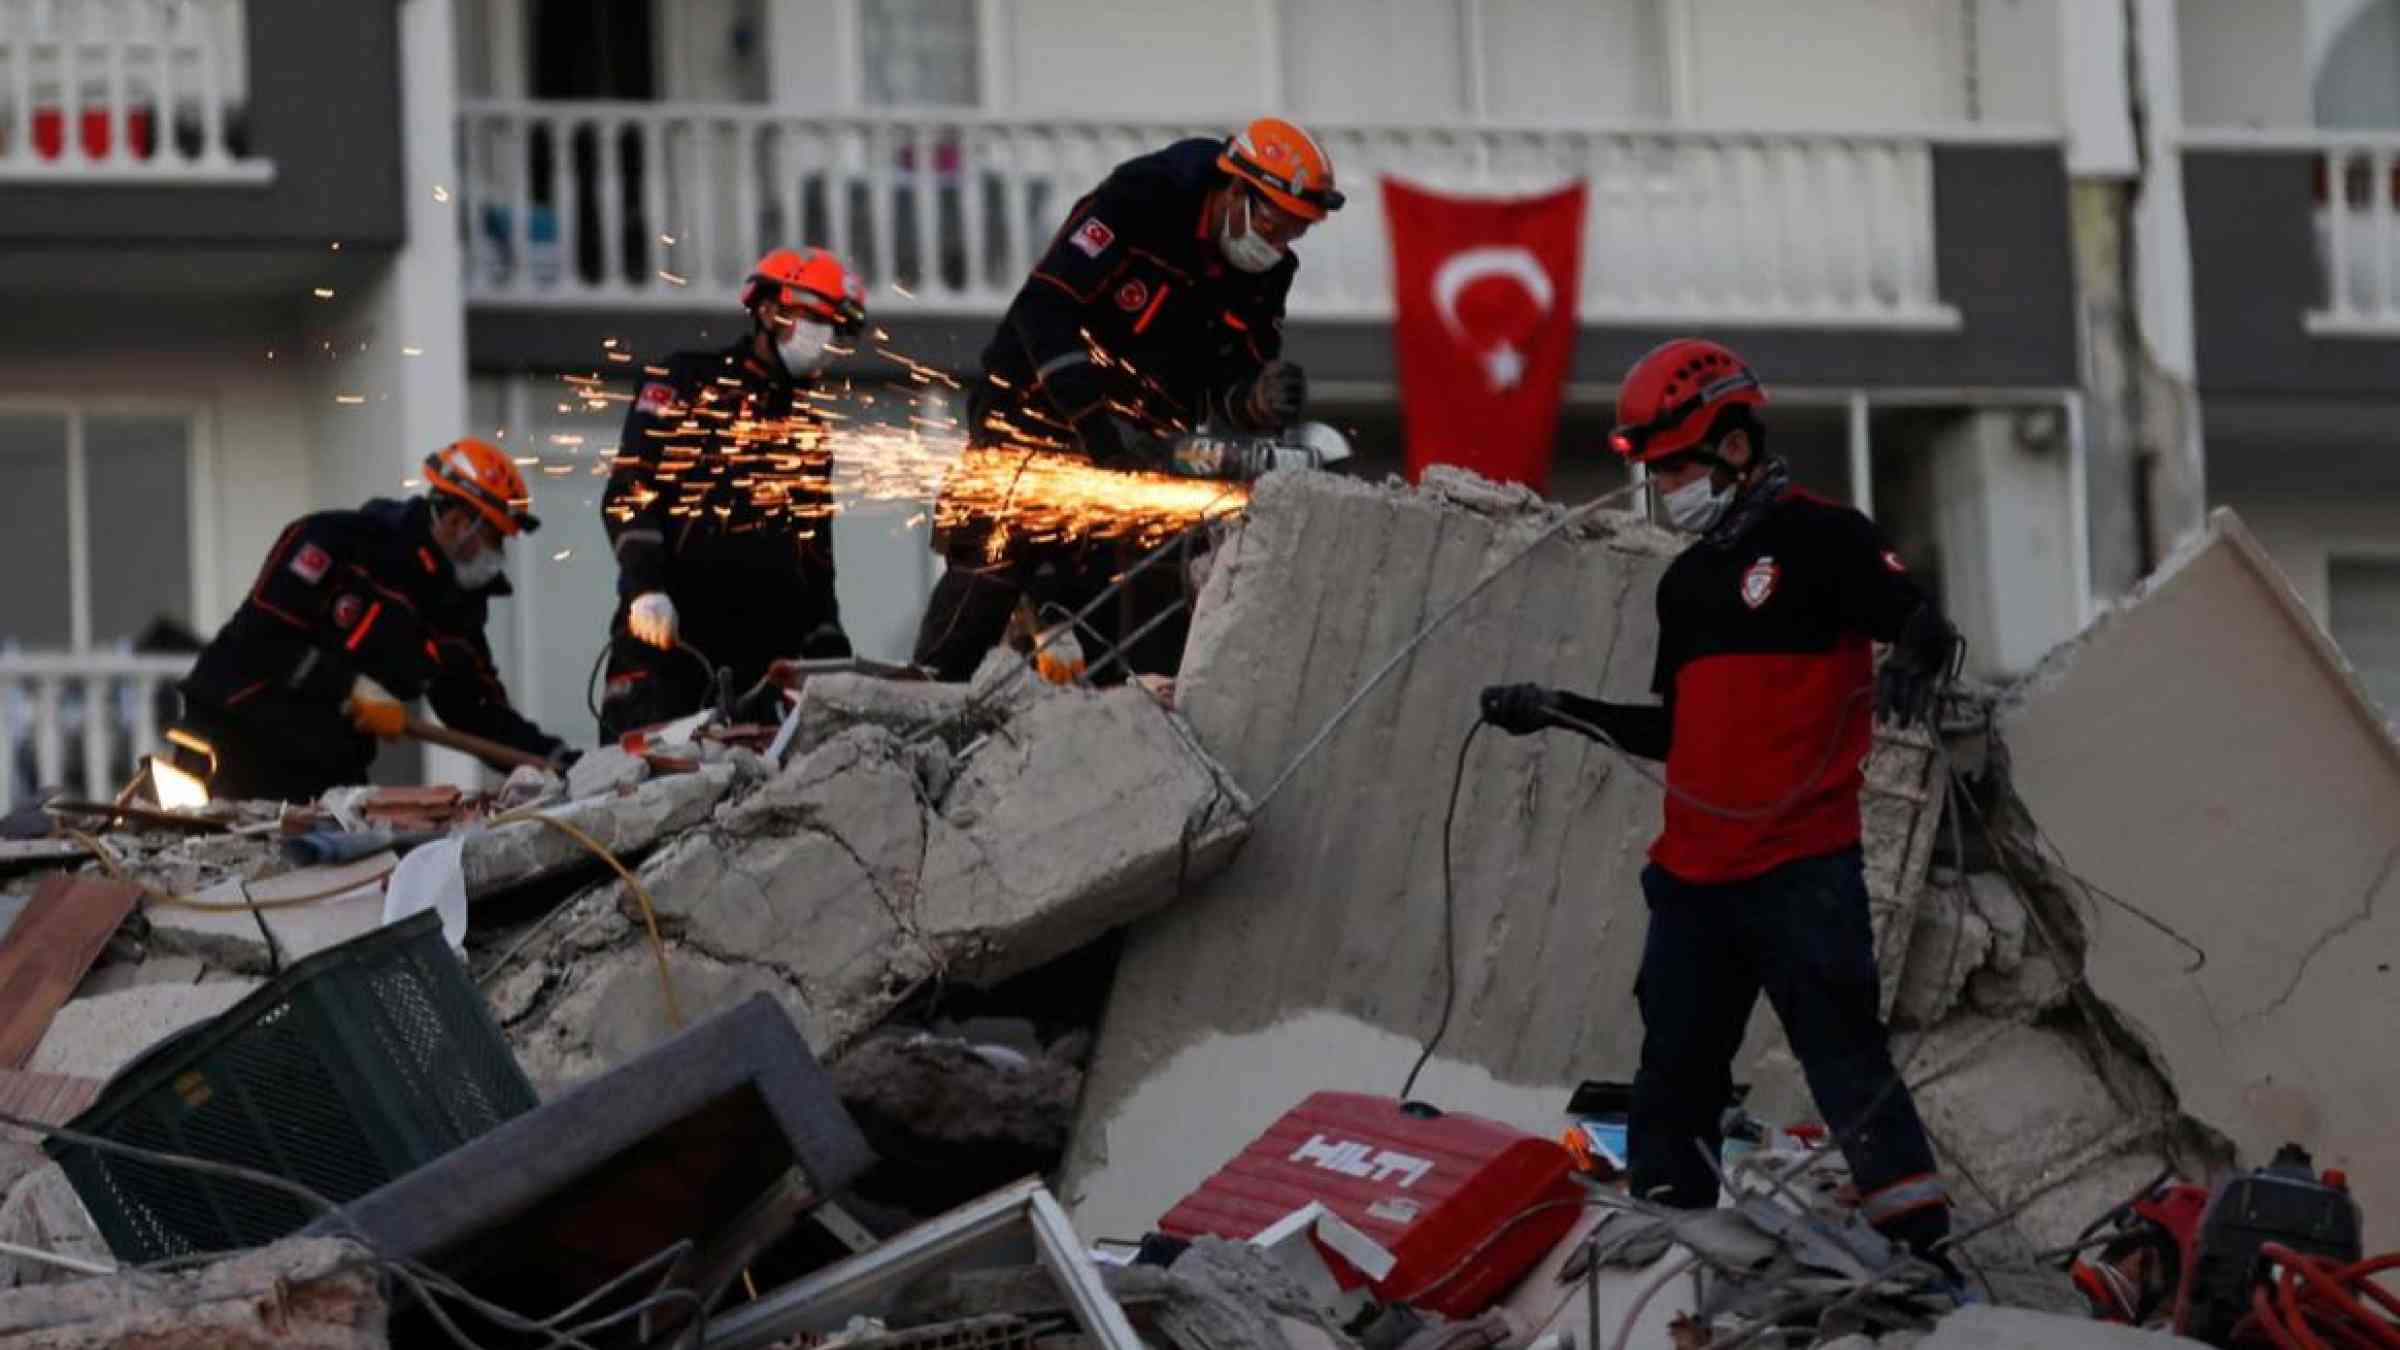
The building stock of İzmir is mostly composed of reinforced concrete buildings. Out of about 250,000 buildings in the metropolitan area, six buildings totally collapsed and about 400 buildings suffered heavy damage. Most of the heavy damage occurred in the Bayraklı district. Other districts with significant building damage are Bornova, Seferihisar and Karşıyaka (Figure 1 and 3). About 4% of the buildings in the city were affected. The location of the six totally collapsed buildings, where the search and rescue activity was concentrated, and nine partly collapsed buildings are indicated with the yellow polygon on Figure 1 and 3. Most of the heavily damaged buildings were built in the 1990s with designs based on the outdated 1975 earthquake resistant design code, with poor code compliance and also with poor construction quality. Furthermore, the structural system of the buildings was modified during their service time to accommodate commercial use in the first floors.
Although strongly shaken, no structural damage was found in the tall buildings (about 30 buildings with heights between 100 m and 240 m). This observation is similar to those in LA Basin exposed to the July 6, 2019 Mw7.1 Ridgecrest Earthquake.
Planning foresight 24 years ago gave us the tools to understand the damage
In 1996, the Secretariat of the United Nations International Decade for Natural Disaster Reduction (IDNDR) launched the RADIUS initiative. The main mission of this three-year program was to promote worldwide activities for the reduction of seismic disasters in urban areas. İzmir was selected as one of the cities for the earthquake risk assessment. This study, conducted for the Metropolitan Municipality of Izmir and completed in 1999, encompassed the assessment of earthquake hazard, geotechnical investigations, microzonation, inventories for elements at risk, determination of the physical and social vulnerabilities and primary and secondary losses (Erdik et al. 2000). The earthquake losses were calculated for the probabilistic hazard associated with 475 years (in other words, the largest earthquake ground motion level with a 10% chance of occurring in 50 years) and a deterministic earthquake of magnitude Mw6.6 on the İzmir Fault. As such, the risk results may not have much relevance to the Oct. 30, 2020 earthquake damage. However, the results of the soil investigations carried out are valid today.
Izmir is built on very soft, young sediments that amplified shaking
The expected amplification of seismic shaking is generally inferred by the average seismic shear wave velocity in the upper 30 m (‘Vs30’). A Vs30 map of the Inner İzmir Bay Basin is provided in Figure 4, after İzmir Earthquake Masterplan. Most of the heavily built areas are located on the soft sediments of the city located in Karşıyaka, Bayraklı, Bornova and Konak districts (Figure 1 and 3).

Figure 4. The distribution of Vs30 (average shear wave velocity in the upper 30m) map of the Inner İzmir Bay Basin (after İzmir Earthquake Masterplan). The polygon enclosing the collapsed building in Figures 1 and 3 lies in the red zone of highest amplification of the seismic waves.
Shaking in Izmir was strong but hardly extreme
The earthquake strong ground motion was recorded by the extensive network of AFAD (Disaster and Emergency Management Presidency). Four of these stations (TR3512, TR3513, TR3414 and TR3519) that were considered for the assessment of basin response, are shown in Figure 1 and Figure 2. The Vs30 values at these stations and the PGA, PGV and the PGD values associated with the ground motion records are provided in Table 1.

Table 1. Strong Ground Motion Stations and the PGA, PGV and PGD values
Stations TR3512 and TR3514 — located on stiff soil sites outside the basin — have very similar ground motion records to one another. The stations TR3513 and TR3519 are located on soft sediments of the basin have also similar ground motion records. The horizontal 5% damped response spectra of these records and the site-specific design basis response spectra (for 475-year average return period) associated with these station locations are provided in Figure 5 for the N-S direction. The low rise (1-3 stories) and mid-rise (4-9 stories) buildings located in stiff soils were exposed to only a fraction (about 10% and 20%, respectively) of the ground motion level if they were designed to code. However, for buildings located on softer soils of the basin, these percentages respectively increase to 30% and 50% and even higher for taller buildings. It can be inferred that if the earthquake were associated with any one of faults around the basin (Izmir and Karşıyaka-Bornova Faults), the ground motion level would have exceeded the code-based site-specific design basis response spectra.
Basin Effects in İzmir
It is well known that the ground shaking in sedimentary basins is amplified by 2-D and 3-D basin effects (trapped surface waves, wave interference and basin edge effects; Somerville et al, 2004), and by 1-D soil amplification due to soft soil profiles. The response spectra associated with the stations located on the soft sediments of the Izmir Basin (Figure 5, TR 3513 and TR 3519) certainly incorporate both the soil amplification (site response) and the basin effects.
The transfer functions of horizontal ground motion between records from stiff soils outside the basin and those from soft soils inside the basin shed light on the amplification of ground motion due to basin and site effects. Such transfer functions can be obtained either by the division of their respective Fourier Spectra or, for earthquake resistant design purposes, by the division of their respective response spectra (Figure 6). As observed in these transfer functions, the period-dependent amplification factors reach about 5 and 3, respectively, for periods of about 1.5 s and 3 s. The amplification factor remains in vicinity of 2 for periods 4 s, 5 s and 6 s. It should be noted that these values are associated with the linear response of the basin sediments. It should be noted that, under higher amplitude ground motions, the amplifications might be lower due to the possible non-linear response of the sediments.

Figure 6. Transfer function between the horizontal 5% damped acceleration.
Ground motion models (e.g., NGA-West2, August 2014 special edition of Earthquake Spectra) are derived from recordings that incorporate site and basin effects, rupture directivity and topographic effects. In these models, the soil amplification effects are essentially incorporated through the Vs30 values. The consideration of the basin effects in the NGA-West2 Ground Motion Models relies on depths to a shear-wave velocity of 2.5 km/s (Z2.5) or 1.0 km/s (Z1.5). Accordingly, such effects are present in the ground motion prediction models only in an average sense. The maximum amplification factors due to basin effects that can be obtained from these ground motion models vary between 1.3 and 2.0 at 5 s, depending on the Vs30, Z1.5 and Z2.5 values associated with the basin.
The NGA-West2 Ground Motion Models also consider the differentiation of ground motion on the down-thrown block (the Izmir Inner Bay Basin) and up-thrown block of normal faults. Sites located on the down-thrown block experience higher ground motions than sites on up-thrown block. For earthquakes that can cause surface rupture and at short distances from the fault rupture, the horizontal PGA on the down-thrown block could be, on the average, about 1.5 times of that on the up-thrown block.
Design-Basis Ground Motion for Long Period Structures in Izmir
In addition to site response and basin effects, the design-basis ground motion spectra should also incorporate rupture directivity effects, if any. Fault directivity motions typically occur at sites near the end of a strike-slip fault when the rupture moves towards the site, and at sites located in the up-dip projection of a ruptured dip slip fault (i.e., reverse or normal fault). The radiation pattern of the shear dislocation on the fault causes this large pulse of motion to be oriented in a direction perpendicular to the fault plane (Somerville et al., 1997). These effects are typically long-period in nature and are observed as large amplitude velocity pulses. The earthquakes associated with the normal faults framing Izmir Inner Bay Basin to the north and south (Figures 1 and 3) have the capability to produce such rupture directivity effects.
These observations indicate that the tall buildings and other long period structures located on the soft sediments of the Izmir Inner Bay Basin could be exposed to higher ground motion levels than those foreseen in the current earthquake resistant design code, if the earthquakes with magnitudes Mw6.5 and larger originate in the faults to the north and south of the İzmir Inner Bay Basin. For such cases, we recommend that the design basis spectra should be assessed on rigorous site-specific investigations that considers the basin and fault rupture directivity effects.