Seaports could lose $67 billion yearly from disasters
Small islands and low-income nations face the largest relative monetary losses to their ports and maritime trade.
Seaports, essential hubs of the global supply network, face billions of dollars in damage every year from such natural hazards as tropical cyclones, earthquakes, and flooding, according to a new analysis. Estimating the annual cost of physical damage as well as the resulting trade losses for more than a thousand ports around the world, researchers found that large ports in high-income nations face the largest financial losses, but that natural disasters are most costly for low-income nations that depend on maritime trade. The results were published in January in Communications Earth and Environment.
Past research has quantified the cost in detail for specific ports or, more generally, for many ports. “I wanted to do both. I wanted to be able to quantify risk to the physical assets and see if we [could] scale this up globally,” said Jasper Verschuur, a postdoctoral researcher in sustainable development at the University of Oxford in the United Kingdom and lead author of the new study. A global analysis could aid in mitigating damage to ports from future disasters and help stabilize the global supply network.
Predicting Seaport Losses
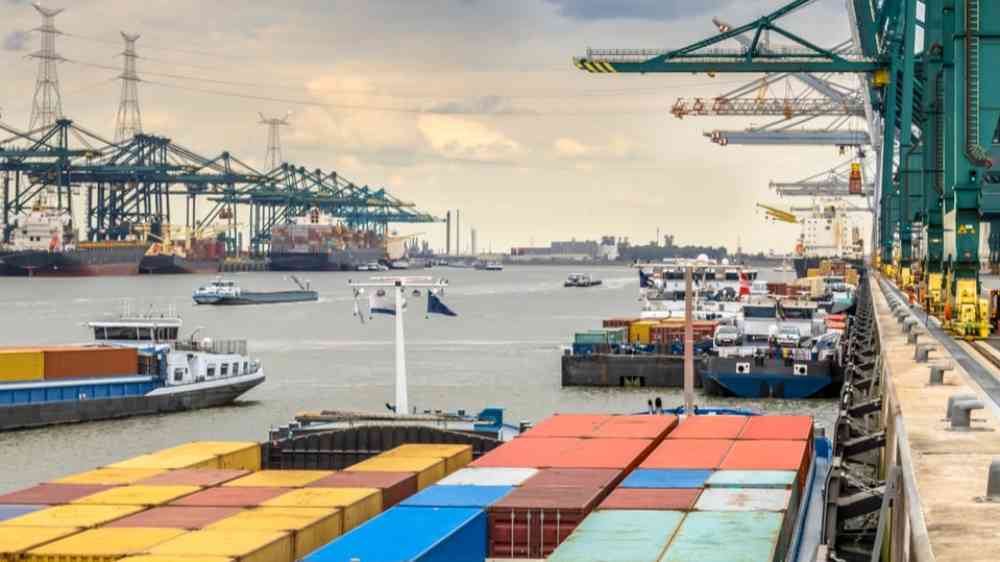
By their nature, seaports are situated along low-lying coastal areas and rivers, locations exposed to a wide range of natural hazards. Extreme winds, storm surges, flooding, landslides, and earthquakes can damage a port’s physical infrastructure, close roads, down electrical lines, endanger port workers, and make it impossible for ships to enter or leave the port safely.
Ports lose money when trade stops or slows, and as climate change worsens the severity of natural disasters and increases their frequency, the magnitude of those losses will rise.
But quantifying that cost, from both physical damage and lost trade, is complex and time-consuming, explained Hussam Mahmoud, a structural engineer at Colorado State University who was not involved with the new study.
The sociophysical models used to predict future losses for individual ports consider such factors as the age of port infrastructure, whether workers and repair crews can get to the port after a disaster, the relationships between port authorities and local governments, and the timeline for recovery—factors that are impossible to generalize for ports across the world. Also, those data are not publicly available for every seaport, and when some are, the models take a long time to build. “We developed our own model for the port of Mobile [Alabama], and it took us 2 years to do that for one port,” Mahmoud said.
“This took me, by hand, almost 3 months and caused a lot of gray hairs.”
Verschuur and his colleagues circumvented this challenge by creating port-specific frameworks using data that can be consistently measured, like areal footprints; assets, including cranes and terminals; and infrastructure, including roads, rails, and power generation. They combined those frameworks with predictive global hazard models.
Then, for 1,340 ports around the world, they calculated the monetary losses from infrastructure damage expected from five common natural hazards—tropical cyclones, river flooding, coastal flooding, pluvial flooding, and earthquakes—as well as the expected value of lost trade. They published their frameworks in a new database.
The process involved painstaking examination of each port in satellite imagery to determine the area and assets at risk from a hazard. “This took me, by hand, almost 3 months and caused a lot of gray hairs,” Verschuur said. “In the end, this is what was needed to bring [the analysis] together and actually come up with risk numbers.” The researchers couldn’t include every port in the world in their study, but Verschuur estimated that their database includes more than 99% of annual maritime trade volume.
Big Risk for Small States
The analysis revealed that the five ports that stand to lose the most each year are those in Houston ($169 million); Shanghai, China ($133 million); Port Elizabeth, South Africa ($123 million); Lázaro Cárdenas, Mexico ($111 million); and Rouen, France ($99 million). Around half of ports face annual losses of at least $1 million, 160 could lose at least $10 million, and 21 could lose at least $50 million.
Combined, $67 billion, or 0.8% of global maritime trade, could be lost from natural disasters annually.

Larger ports face the largest monetary losses from natural hazards because of their size and the high volume of trade they facilitate, Verschuur explained. But those ports are located in countries with diversified economies and the resources to quickly fix damage, update infrastructure, increase resilience, and install redundancies to reduce future losses.
Island states and low-income coastal nations, however, typically depend heavily on maritime trade. They also tend to have older port infrastructure, fewer operational and logistic redundancies, and fewer resources to identify vulnerabilities ahead of time and repair damage afterward. Because of these factors, natural hazards are costliest for ports in the Northern Mariana Islands, Guinea-Bissau, Guam, the Philippines, and Dominica.
Nearly all ports included in this analysis have experienced at least one natural hazard every year, and about half experienced four or five hazards every year. Flooding and tropical cyclones drive most physical losses, especially in cyclone-prone regions such as the Gulf of Mexico and the western Pacific Ocean. Earthquakes drive losses in Japan, Chile, and the Mediterranean.
“The vast majority of ports need to consider multiple hazards in the design and operation of infrastructure,” the researchers wrote.
Build Climate Resiliency In
The researchers noted that their analysis considered damage from natural hazards individually. In reality, damages from sequential disasters might compound each other. And though tsunamis do present significant risk to seaports, tsunami hazard modeling is not yet developed enough to have been included in this analysis, the team said.
“Embedding a bit of climate change adaptation up front in your investments is going to be so much cheaper than not doing it and realizing in 10 or 20 years that you have to retrofit it.”
“Overall, this paper provides valuable insight into what might be expected for monetary losses,” Mahmoud said. “Still, of course, the reality could be different than what has been estimated due to the many assumptions made and the complexity of the analysis required if high-level accuracy is needed.” He added that he would like to see a future analysis that includes consideration of how trade through a port varies throughout the year compared with time-dependent hazards (e.g., cyclone seasonality), as well as more detailed estimations of recovery times.
The new analysis provided a starting point for port authorities and regional policymakers to identify where existing seaports need more natural hazard mitigation, Verschuur said. But the cost of natural hazards should be taken into account as well when building new ports to handle the ever-growing global maritime trade volume. “Embedding a bit of climate change adaptation up front in your investments is going to be so much cheaper than not doing it and realizing in 10 or 20 years that you have to retrofit it,” he said.