By Sarah Derouin
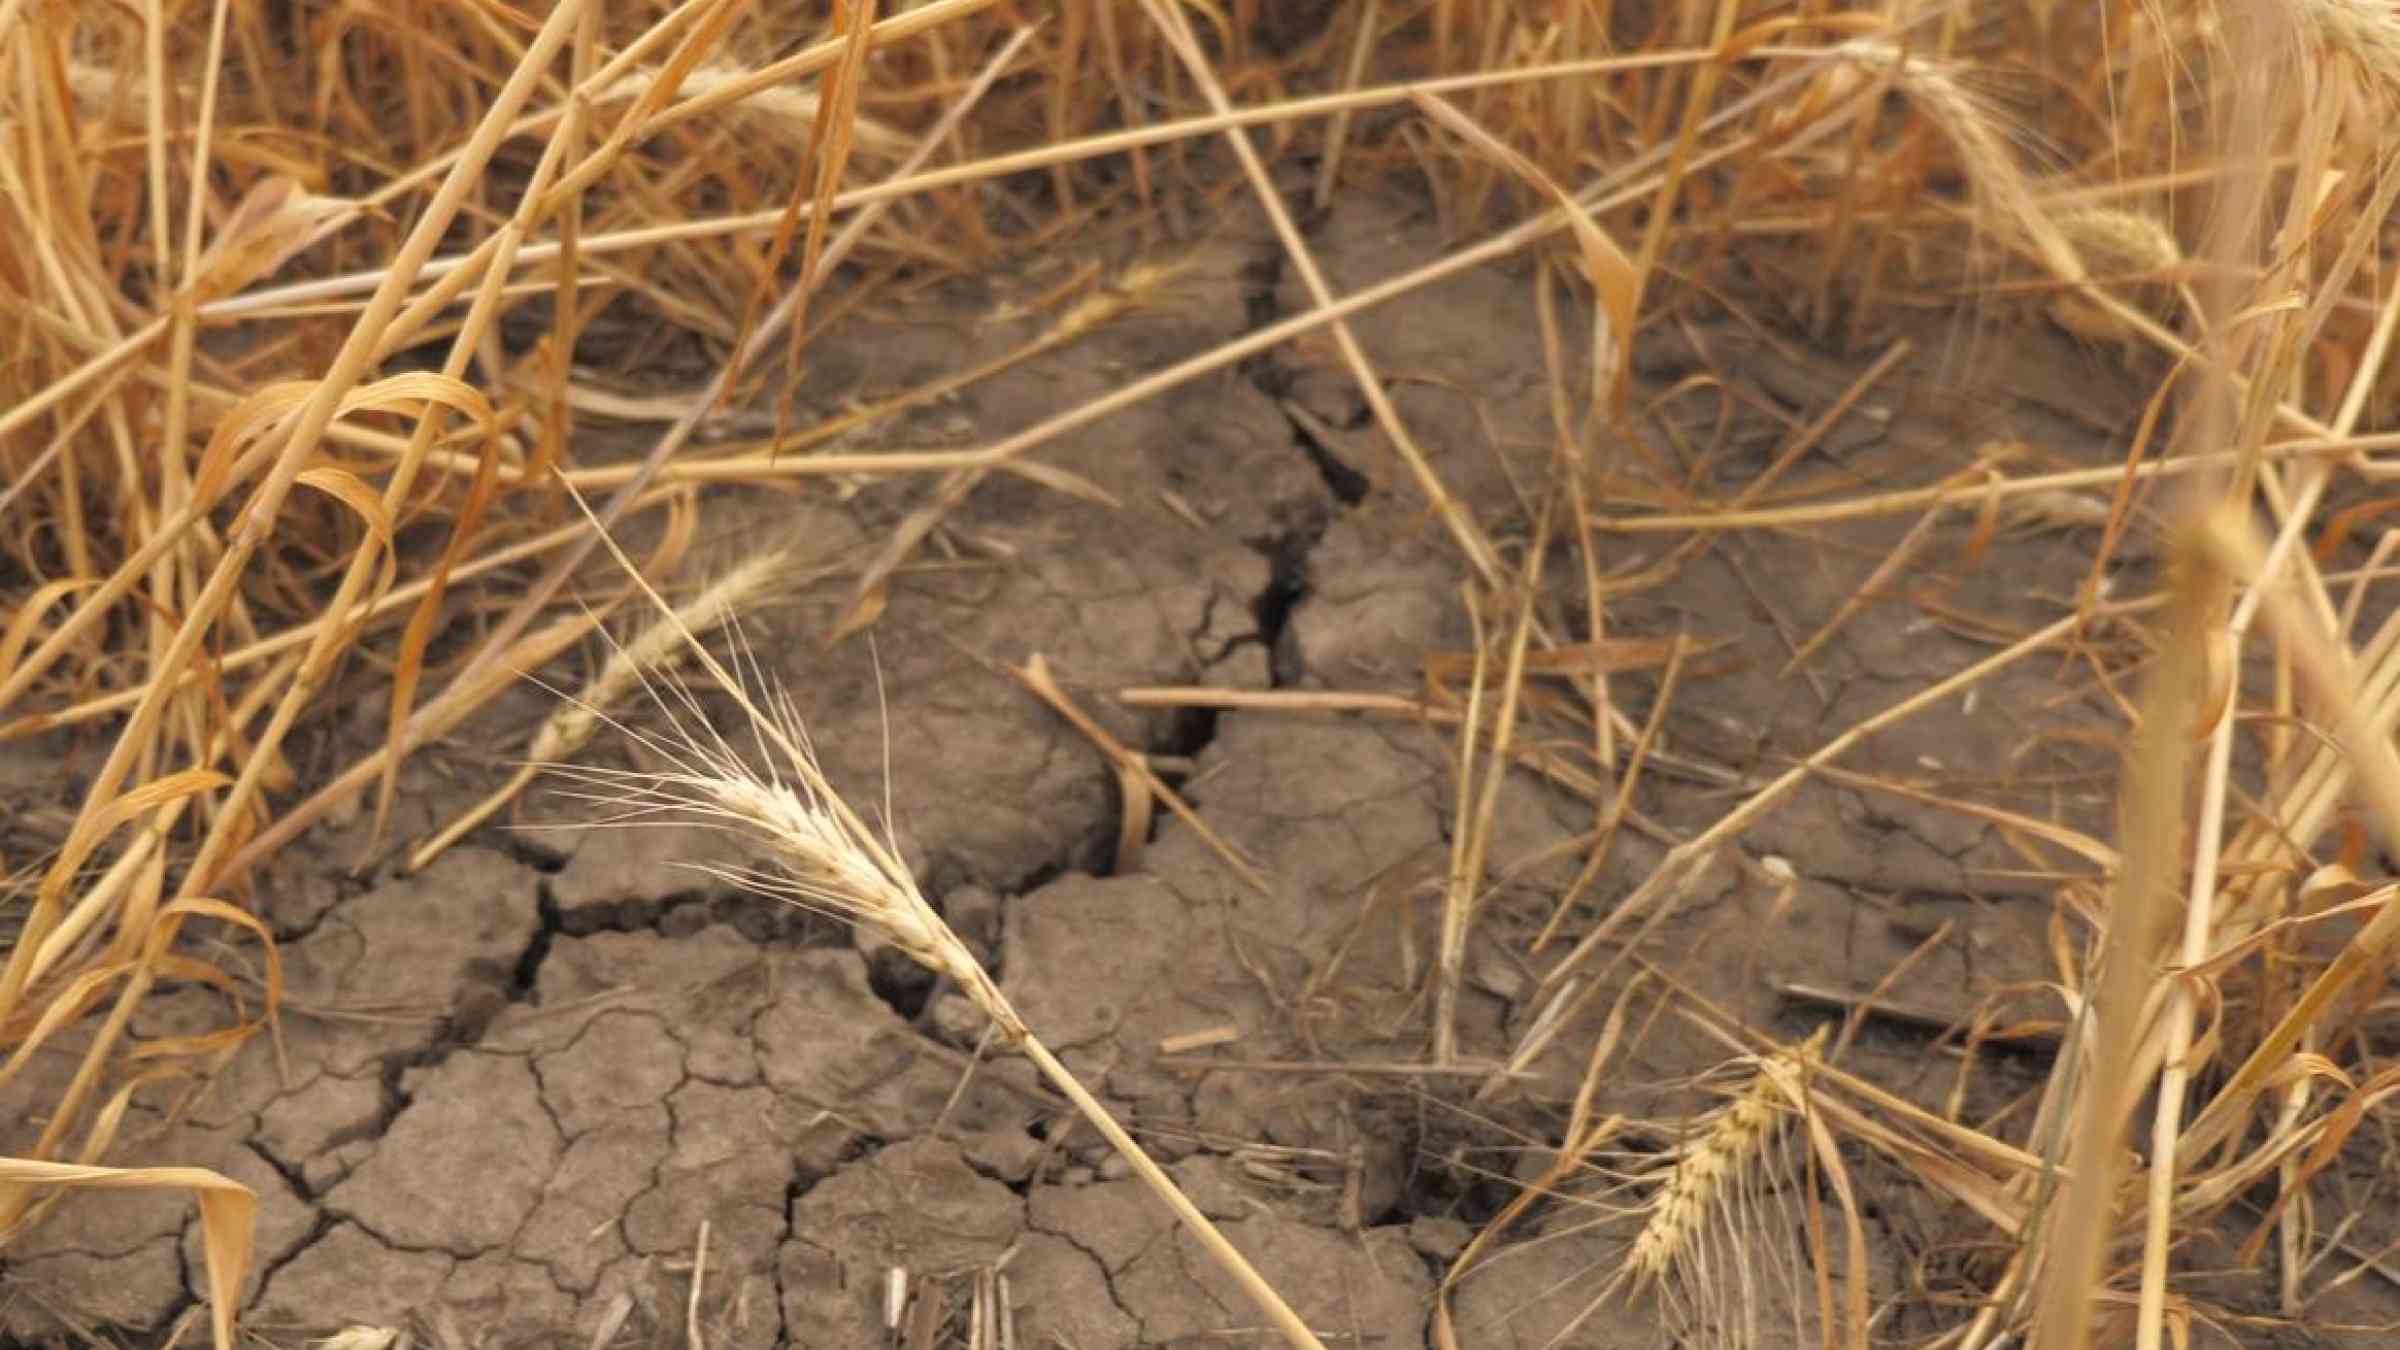
Record-breaking heat waves and lingering droughts have become commonplace over the past few decades. When these natural hazards hit at the same time, their impacts are cumulative and can cause great distress to society and ecosystems. But how often do simultaneous events occur?
To better understand where and when events overlap, researchers recently analyzed global temperature and precipitation data from the past 4 decades. They noted increasing occurrence and length of combined drought–heat wave (CDHW) events, especially over the past 20 years. Their work will be helpful for regional forecasting and hazard preparation around the world.
Combined Stressors
In recent decades, the interplay between heat waves and drought has garnered increasing attention from researchers, emergency managers, and community leaders. A new study takes prior research one step further: understanding where CDHW events occur and better refining how often and how long they can last.
“Many studies have been published…which actually combined these two events in a single framework, but none of them has looked into this finer (daily to weekly) temporal scale,” said Sourav Mukherjee, a graduate student at Clemson University and coauthor of the study published in Geophysical Research Letters.
It’s this finer resolution that is the “key innovation in this story,” said Ashok Mishra, a professor of civil engineering at Clemson and coauthor of the study. By looking at weekly records of drought and heat waves instead of monthly data, Mishra said that their method can provide a more refined idea of risks associated with the events.
Hotter, Faster, Stronger
The team compiled almost 4 decades (1983–2016) of temperature and precipitation records from the Climate Prediction Center, Berkeley Earth Surface Temperature Project, and Global Precipitation Climatology Centre. Heat waves were identified by temperatures exceeding the 90th percentile for more than 3 days. Droughts were determined by the weekly Palmer drought severity index.
The team also took background aridity into consideration. They divided the land surface into arid, transitional, and humid regions using the European Centre for Medium-Range Weather Forecasts Reanalysis 5 data, which measures potential evaporation in a region.
The researchers found that several regions around the world had increasing frequency, duration, and severity of CDHW events. They also found that over the time period studied, the number of CDHW events increased between one and three events every year, whereas the duration of such events increased by 2–10 days per year.
“When we look at the temporal trends of CDHW, we find that there is a sharp increase from 2000 onwards,” said Mukherjee, which coincides with a global warming trend. Mishra added that “multiple data products demonstrated the robustness of the results.”
The trend isn’t evenly distributed around the world, however. Mukherjee said that there are more events in the Northern Hemisphere, for instance, and the researchers also saw a trend in arid versus humid regions. “We see that the arid regions consistently show a significant increase in these events, while most uncertainty is captured in the humid equatorial band,” said Mukherjee.
Moetasim Ashfaq, an atmospheric physicist at Oak Ridge National Laboratory in Tennessee, suggested that the correlations between aridity and frequency might have something to do with the way scientists define heat stress. “If you include humidity [in heat wave designation], then you have other regions and monsoon belts where you’d see a signal that would actually get amplified,” said Ashfaq, who was not involved in the study.
Ashfaq also noted the spatial differences that arose in the study. “If you look at global means, they look very similar,” he said. “But if you look at the spatial map, there are striking differences.”
Ashfaq attributed the discrepancies to the sheer scale of the study. “Because they were doing global analysis, not all data sets have high resolution,” he explained.
However, Ashfaq noted that “even if you look at this asymmetry…frequency [of CDHW events] is increasing and severity is increasing.”
One Thing Leads to Another
Often, stressors such as heat and drought can lead to cascading events, said Ashfaq. He said a good example is what has happened in California over the past few years: drought followed by wildfires, heavy rainfall, and an increasing number of landslides.
“We need to have better frameworks to understand the cascading impacts of these extremes,” said Ashfaq. “We know that because the temperature is increasing, we expect these [events] are going to increase.”
The researchers view this work as a good jumping off point for further analyses. “This study provides the global map where these events are prominent,” said Mishra.
Ashfaq agreed, noting that the work can be used to further drill down into regional studies. “There’s more research needed, both in terms of understanding different kinds of compound extremes and how they can impact natural and human system.”
