New online portal forecasts coronavirus transmission to aid officials in management, planning
By Brandi Klingerman

Researchers at the University of Notre Dame have developed an online portal that forecasts how hospital services and resources may be impacted during the ongoing coronavirus pandemic. Developed for government and public health service officials, the portal models predict COVID-19 disease transmission by using county data of daily reported infections and current human movement restrictions, such as shelter-in-place and social distancing orders.
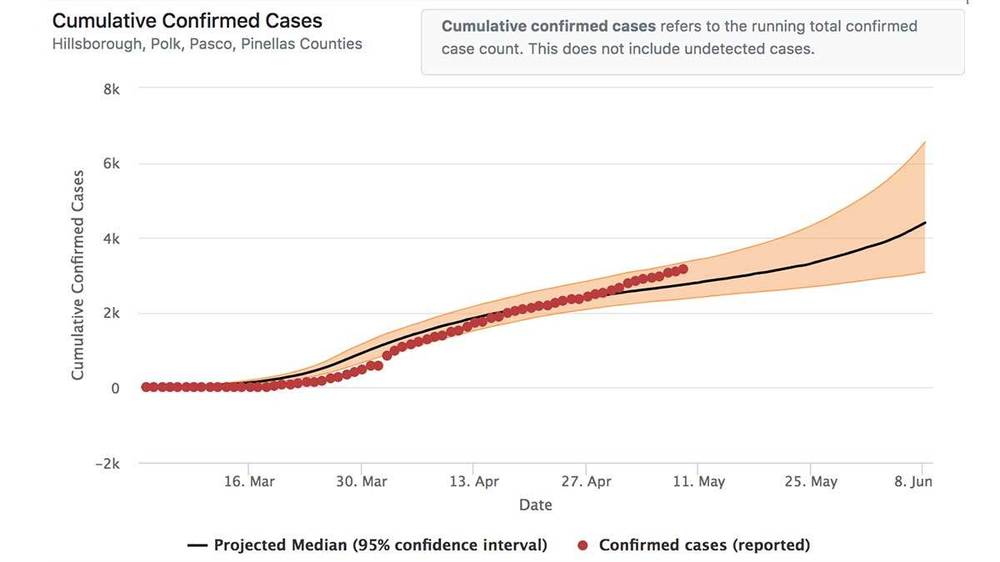
In collaboration with the University of South Florida, Notre Dame researchers have initially modeled impacts in the Tampa Bay, Florida, area, which includes Hillsborough, Pasco, Pinellas, and Polk counties. The researchers showed how the Tampa Bay area could be affected if government officials relaxed various restrictions, including when a second wave and peak of the COVID-19 pandemic would occur, how many people would be affected and how the need for hospital beds, ICU care and ventilators would fluctuate.
“We know that the restriction to human movement has done its job in limiting disease transmission,” said Edwin Michael, professor of biological sciences at Notre Dame and lead investigator on the project. “Now officials are trying to decide if and when they should relax those restrictions, or what interventions are needed in order to do so, and they need predictions to help with these decisions at local administrative levels. This tool provides a platform to look at those different options and view the potential outcomes.”
The model used by the portal is updated daily based on cumulative cases and deaths per county, which helps improve the reliability of immediate and future forecasts. The online portal created with the Center for Research Computing at Notre Dame provides public health and government officials an opportunity to test how different measures — such as lockdowns, social distancing and quarantines — might affect the timing and number of coronavirus cases that could emerge in a county so that appropriate mitigation measures and hospital resources can be planned.
For example, the model showed that in the Tampa Bay area the peak number of cases in the first wave has likely already occurred, but only if current government lockdown restrictions are maintained until the end of June. Additionally, releasing lockdown restrictions before the first wave ends will lead to a significantly bigger second wave of the pandemic, requiring prolonged social distancing measures and planning for contact tracing, testing and the isolation of new infectious cases.
“Our goal was to provide an accessible tool with up-to-date data that helps state and local leaders better understand how their decisions today could impact the health and safety of communities down the road,” said Michael, an affiliated member of the Eck Institute for Global Health. Researchers are currently creating models that showcase the state of Indiana for the online platform.
Notre Dame researchers on the project are Morgan Smith, Kenneth Newcomb, Rose Donohue and Rocío Caja Rivera from the Michael Lab and Christopher Sweet, Sebastian Wyngaard, Caleb Reinking and Kristina Davis from the Center for Research Computing. Collaborators from the University of South Florida are Thomas Unnasch, Robert Unnasch and Marissa Levine. The team is also guided on policy by Priya Michael, assistant economist for the Central Analysis Unit in London.
To learn more about the COVID-19 forecasting and planning portal, visit covid.crc.nd.edu.