What is measured
This indicator measures fire danger potential, using the New Zealand Fire Danger Rating System, at 30 sites around Aotearoa New Zealand from 1997 to 2023, although not all sites start at 1997.
We report the average number of very high or extreme (VHE) fire danger class days per year for 30 sites between 2014 and 2023. Fire danger classes are estimated using two separate fuel types - forest or grass. This allows for consistent comparisons of the number of VHE fire danger days based on potential fuel type.
Fire danger classes provide a broad-scale assessment of the likelihood of wildfires occurring and spreading in an area. VHE fire danger represents significant risk of large wildfire outbreaks that may require much effort to control. Days of VHE fire danger don't necessarily mean a wildfire did, or will, occur. Similarly, wildfires can occur even if the fire danger is not VHE. This is because an ignition source is needed for a wildfire to occur.
We also report annual trends for VHE fire danger days, based on the forest fuel type, for 28 sites between 1997 and 2023.
Why it is important
There were 4,417 wildfires and 4,864 hectares burnt between 1 July 2021 and 30 June 2022. On average, there were 4,683 wildfires per year in the five years to 30 June 2022 (Gross et al., 2024). Wildfires can lead to the loss of biodiversity, economic losses, and loss of life and property. Smoke from wildfires can impact human health through reduced air quality. Wildfire risk in many parts of New Zealand is expected to increase due to higher temperatures, stronger winds, and lower rainfall and humidity associated with climate change (Langer et al., 2021).
Key findings
Fire danger days calculated using forest as the fuel type
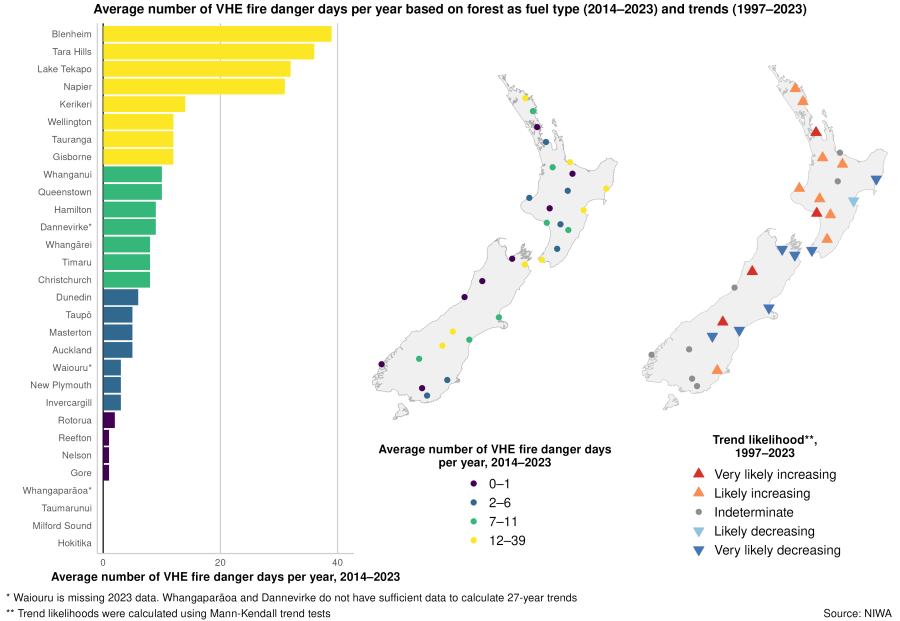
In 2023, the most VHE fire danger days (when forest was used as the fuel type) were at Tara Hills, Lake Tekapo, and Queenstown (32, 30, and 19 days, respectively). Data was not available for Waiouru in 2023.
Between 2014 and 2023, the average number of VHE fire danger days was highest:
- at Blenheim, Tara Hills, and Lake Tekapo (38.6, 36.4, and 31.7 days per year, respectively)
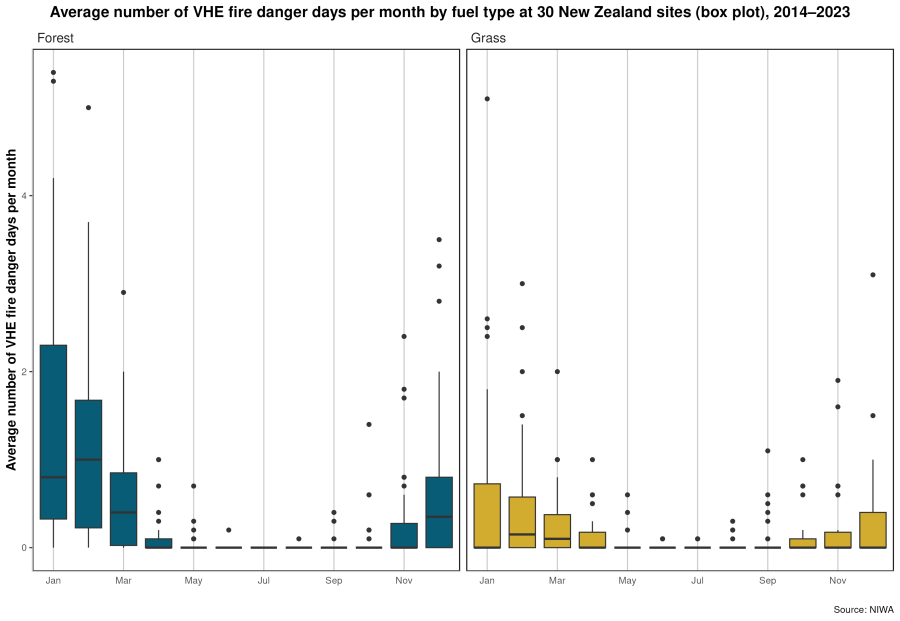
- in January with 3 days per month, averaged over all sites
- in February 2020 with 6.8 days, averaged over all sites.
Between 1997 and 2023, the average number of VHE fire danger days:
- likely or very likely increased at 13 sites across New Zealand
- likely or very likely decreased at 8 sites.
Seven sites had indeterminate trends.
The percentage of sites in each trend likelihood category changed during the period 1997 to 2023.

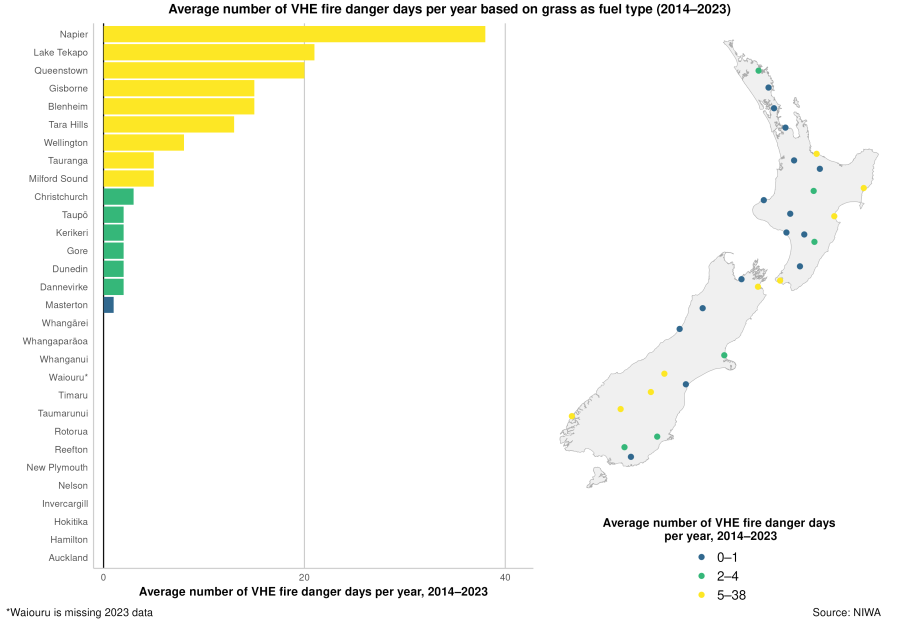
Fire danger days calculated using grass as the fuel type
The vegetation type can have a significant influence on potential fire behaviour, and subsequently fire danger. For this reason, fire danger is often calculated for other fuel types in addition to forest, such as grass.
In 2023, the most VHE fire danger days (when grass was used as the fuel type) were seen at Tara Hills, Lake Tekapo, and Queenstown (20, 16, and 12 days, respectively). Data was not available for Waiouru in 2023.
Between 2014 and 2023, the average number of VHE fire danger days was highest:
- at Napier, Lake Tekapo, and Queenstown (37.9, 20.9, and 19.6 days per year, respectively)
- in January with 1.3 days per month, averaged over all sites
- in January 2017 with 3.3 days, averaged over all sites.
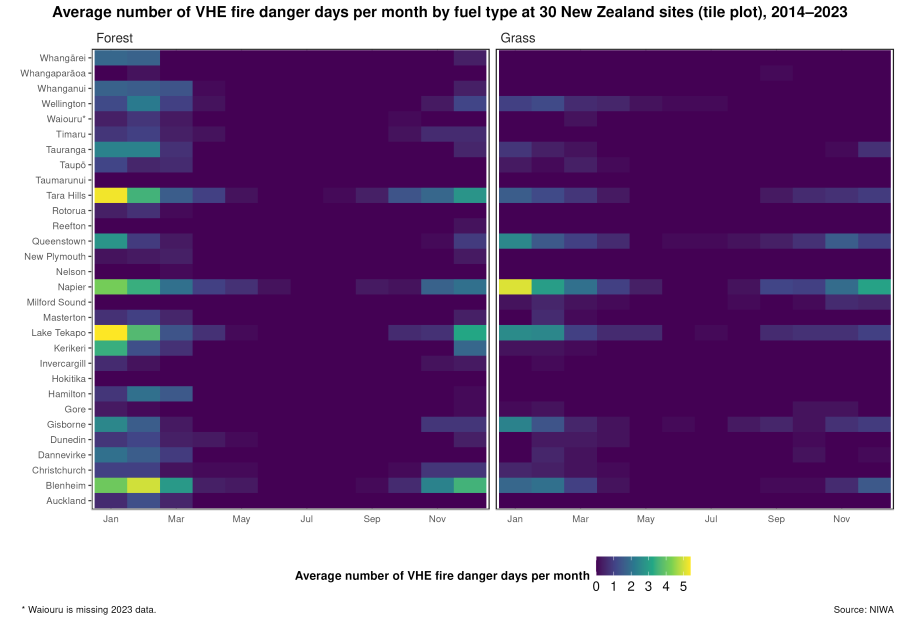
VHE fire danger days higher in summer for forest and grass fuel types
Between 2014 and 2023, the average number of VHE fire danger days per month was generally higher in the summer.