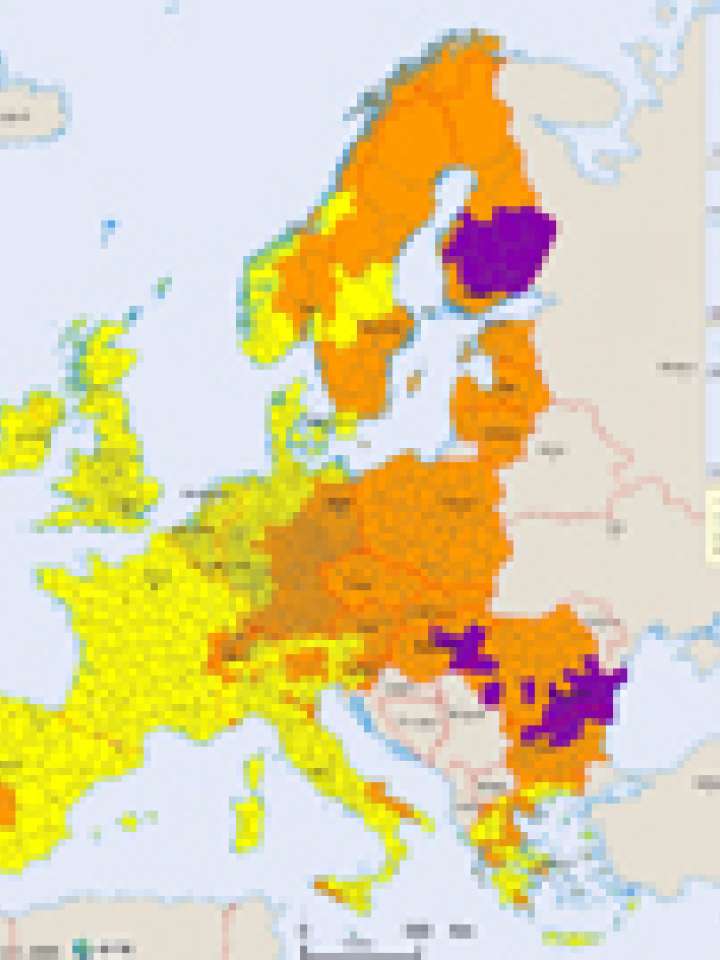
Europe: extreme temperature hazard map
This map shows hot days and waves and cold days and waves hazards in Europe. These four indicators are classified into categories and their mean values are used to build the map. In EU 27+2 where both, extreme coldness and extreme heat appear in the same area.
The map shows a general trend of an increasing extreme temperature hazard from west to east. Northern Europe shows a higher hazard than southern Europe. The reason for these trends is that the more continental the climate, the more extreme the temperature differences.
More continental climates show stronger annual temperature amplitude than marine influenced climates. This effect might grow in connection with climate change.
Considered data cover the 1961-1990 period, and come from the Swedish Meteorological and Hydrological Institute (SMHI) Rossby Centre's Regional Atmosphere-Ocean Model (RCAO).
Explore further
