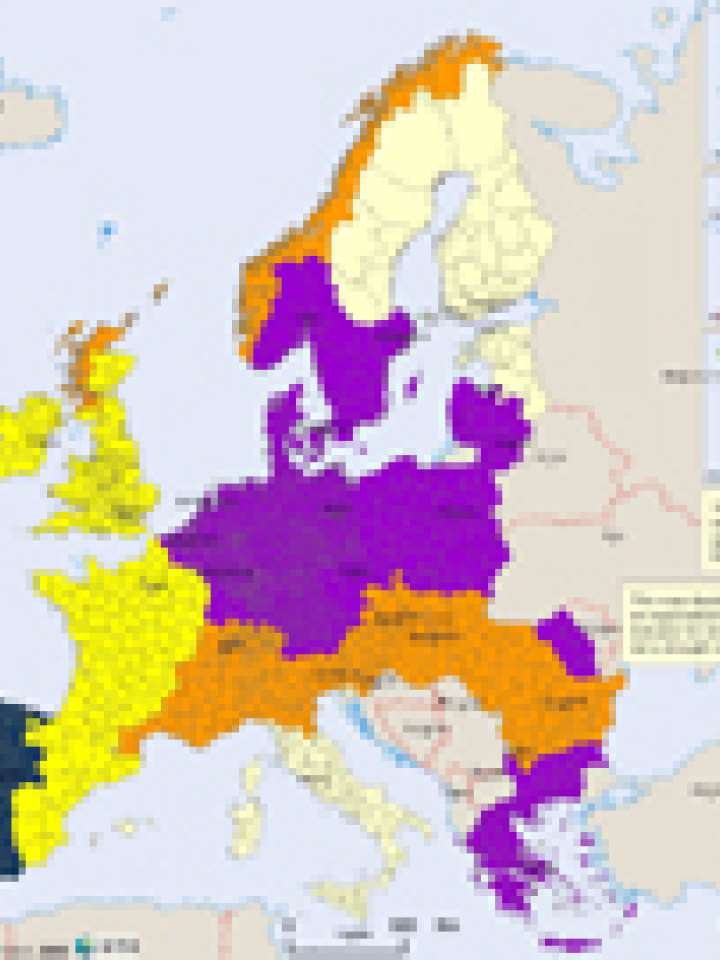
Europe: precipitation deficit as drought potential indication
This map illustrates a comparison of hydrological drought hazard on European scale. Hydrological droughts are those that best describe the impact on power production and the industry, which is the major reason of economical damage by droughts. Other types of droughts are limited for European wide comparisons, as e.g. agricultural droughts are dependent on local circumstances (vegetation types, plant water demands, etc.); and meteorological droughts might expand beyond areas of hydrological droughts.
Since the ESPON Hazards project did not get appropriate data sets for making such a hydrological drought map, it focused on the report of Alavarez and Estrela (2001), which considered the total number of events from 1904 to 1995. The ESPON Hazards project merged the table and the map and displays the resulting drought events on NUTS 3 level. This approximately 100-year-long record does not predict future areas that might be hit by droughts. Since the map is based on historically reported drought events, the data accuracy is variable. Therefore the map is applicable as a general overview map on the large drought problem in Europe. The resulting drought hazard is calculated from the amount of droughts per NUTS 3 level during the last century.
The map shows interesting patterns and issues drought potential on a European scale. For example, Norway has problems with water deficiency because the country's economy is strongly depending on hydropower. Even though Norway has some of the rainiest places in Europe small negative deviations in precipitation can lead to energy problems because the water reservoirs are not refilled appropriately (Cherry et al.). The map also shows that the Mediterranean area has a wide variety of the drought potentials. Meanwhile Portugal and western Spain have the largest drought potential in Europe, eastern Spain appears to have generally a lower potential. Some areas in southern Europe that are usually associated with droughts appear less dramatic in this map. The reason for this lies in stronger local effects of agricultural droughts, as these might partly be related to the adequacy of agricultural systems and related water scarcity.
A problem in this map are the severe jumps of two classes in some areas, e.g. in northern Europe. Also southern Italy appears to have a low drought potential, eventhough it is surrounded by areas with a higher drought potential. The reason for this might be that the drought problem in southern Italy is not directly related to precipitation deficits but to other reasons not displayed here. As mentioned above, the data and map shown here represent an indicator for drought potential. The data are gathered over a long time period with scarce information and shown on clusters of European regions.
Due to the existing limitations of the map, its results are not used as a basis for specific policy recommendations on droughts in particular. The map shown is only to be used as one indication of many in the drought hazard discussion and much more research is needed for the production of a drought hazard map for Europe.
Explore further
