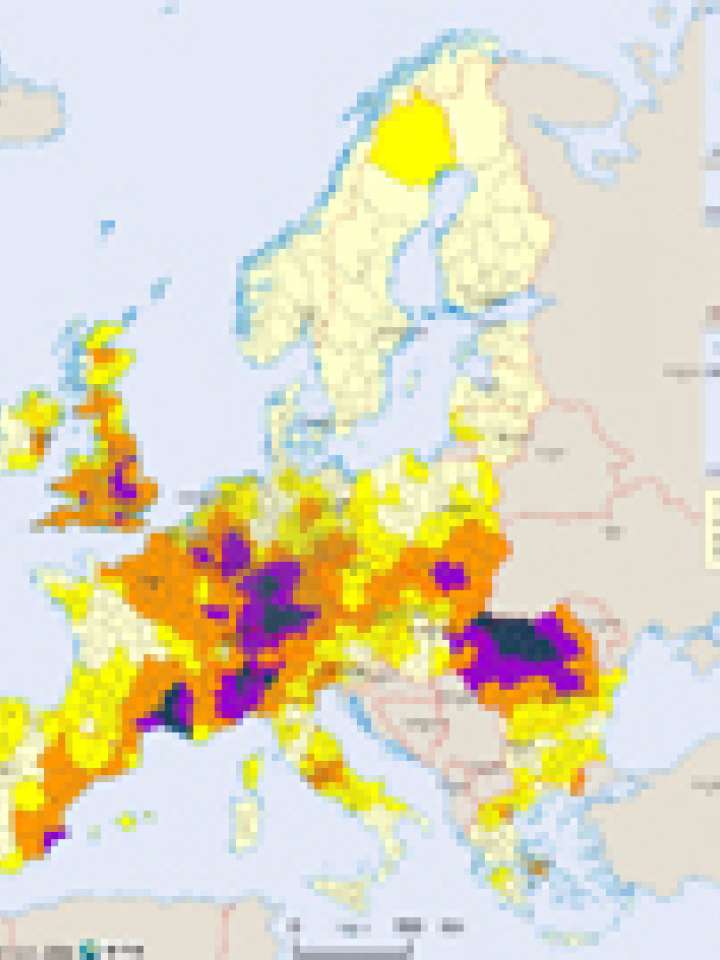
Europe: flood recurrence map
This map illustrates flood recurrence in Europe, based on the frequency of floods in the time span of 1987-2002. The regional flood hazard for this 15-year period is displayed on NUTS 3 level (administrative boundaries of regions). The methodological approach focuses on areas that have actually been affected by floods and does not take local or regional flood prone area mapping into account.
The large river flood maps are mainly based on the "Global Active Archive of Large Flood Events" of the Dartmouth Flood Observatory. Some floods were completed from other sources (Rhine Atlas, 2001 and Envisats online data sets). The Global Active Archive of Large Flood Events by Dartmouth Flood Observatory does not yet completely cover the time period 1985-2002. The flood events archive is under supplement work and the aim is to add the data from missing years continuously.
The highest amount of large flood events between 1987 and 2002 are concentrated in north-western Romania, south-eastern France, central and southern Germany and in the east of England. The source data was obtained through satellite images and the mapped areas may not coincide to 100% with areas that have actually experienced floods. Even though this kind of map is actually not usable as a flood prone area map, as it displays the past events and does not calculate possible future events, it gives a representative picture of the flood hazard. This was shown for example in the floods that have hit southern France in 2004, as the flood hazard map depicts this area as one with a high flood hazard.
Explore further