Global risk data sets

The global risk landscape is becoming more complex, uncertain, and fast-moving, making access to risk information more important for decision-making.
The production of high-quality risk information and analysis is a priority for disaster risk reduction practitioners. With advances in computing power, data availability and use of artificial intelligence, UNDRR continues to encourage open access to an expanding range of disaster risk data as a global digital public good. In the context of global cooperation to improve risk data standards, UNDRR continues to promote understanding of how risks develop and accumulate into shocks and disasters, where threats to resilience and sustainability will emerge, and where mitigation and risk reduction strategies need to be put in place.
UNDRR aims to promote better access to global open-source datasets, advancing standards, cooperation among diverse producers and users of risk data, and to build use cases that underscore the importance of closing the digital divide between global generators of risk data and country-level users.
Benefits of the global risk data collection include:
- Easier discovery, access, use, and sharing of high quality global risk data sources;
- Better understanding of the value of these global sources and use-cases at multiple scales, e.g., regional, national, sub-national;
- Optimized use of risk-relevant data to strengthen risk-informed decision-making within a well-known and trusted information environment.
Global risk data collection
The global risk data collection currently comprises more than 100 entries with links to sources and selected metadata which can be used and adapted in national and sub-national risk information systems. The collection will be updated annually. The collection is searchable by Hazard Information Profiles (HIPs), originator of the global risk dataset, and keyword.
108 records found
Global Earthquake Model (GEM) Foundation
Search: OpenQuake Map Viewer - Global Exposure Map
Search: Global Earthquake Model (GEM) Foundation
Type: Exposure
The Global Exposure Map (v2018.1) presents the geographic distribution of residential, commercial and industrial buildings. The number of buildings is presented on a hexagonal grid, with a spacing of 0.30 x 0.34 decimal degrees (approximately 1,000 km2 at the equator). The datasets employed to develop this exposure map were provided by national institutions, or developed within the scope of regional programs or bilateral collaborations. This global map and the underlying databases are based on best available and publicly accessible datasets and models. The Global Exposure Map is intended to be a dynamic product, such that it may be updated when new datasets and models become available. Releases of updated versions of the Global Exposure Map are anticipated on a regular basis. Additional exposure and risk metrics for each country can be explored at https://www.globalquakemodel.org/gem.
Type: Geohazards
Cluster: Seismogenic (Earthquakes)
Hazard: Earthquake
Global Earthquake Model (GEM) Foundation
Search: OpenQuake Map Viewer - Global Building Exposure 2023
Search: Global Earthquake Model (GEM) Foundation
Type: Exposure
The Global Exposure Model is a mosaic of local and regional models with information regarding the residential, commercial, and industrial building stock at the smallest available administrative division of each country and includes details about the number of buildings, number of occupants, vulnerability characteristics, average built-up area, and average replacement cost. The dataset is developed and maintained by the GEM Foundation, using a bottom-up approach at the global scale, using national statistics, socio-economic data, and local datasets. The datasets employed to develop this model were provided by national institutions, or developed within the scope of regional programs or bilateral collaborations. The global maps and the underlying databases are based on best available and publicly accessible datasets and models. This model allows the identification of the most common types of construction worldwide, regions with large fractions of informal construction, and areas prone to natural disasters with a high concentration of population and building stock.
Type: Geohazards
Cluster: Seismogenic (Earthquakes)
Hazard: Earthquake
Oasis Hub; Insurance Devlopment Forum
Search: Open Exposure Data (OED) [standard]
Search: Oasis Hub; Insurance Devlopment Forum
Type: Exposure
Open Exposure Data (OED) is a standard that provides the industry with a robust, open, and transparent data format with the aim to deliver a common framework for encoding, transmitting, and interpreting data. The aim of OED is to improve interoperability between platforms and models and to reduce frictional costs by significantly decreasing data processing efforts and supporting more efficient cross-model analytics. OED can support Property, Liability and Cyber classes of business.
Deutsches Zentrum für Luft- und Raumfahrt (DLR) - German Aerospace Centre
Search: EOC Geoservice Maps - World Settlement Footprint (WSF) - Sentinel-1/Sentinel-2 - Global, 2019
Search: Deutsches Zentrum für Luft- und Raumfahrt (DLR) - German Aerospace Centre
Type: Exposure
The World Settlement Footprint (WSF) 2019 is a 10m resolution binary mask outlining the extent of human settlements globally derived by means of 2019 multitemporal Sentinel-1 (S1) and Sentinel-2 (S2) imagery. Based on the hypothesis that settlements generally show a more stable behavior with respect to most land-cover classes, temporal statistics are calculated for both S1- and S2-based indices. In particular, a comprehensive analysis has been performed by exploiting a number of reference building outlines to identify the most suitable set of temporal features (ultimately including 6 from S1 and 25 from S2).
World Health Organization (WHO)
Search: Ambient Air quality database [World Health Organization (WHO)]
Search: World Health Organization (WHO)
Type: Exposure; Hazard
WHO's air quality database compiles data on ground measurements of annual mean concentrations of particulate matter of a diameter equal to or smaller than 10 μm (PM10) or equal to or smaller than 2.5 μm (PM2.5) which aim at representing an average for the city or town as a whole, rather than for individual stations. The database currently hosts 4300 human settlements in 108 countries and is updated on a regular basis. The database is updated regularly every 2-3 years since 2011. The data compiled in this database is used as input to derive the Sustainable Development Goal Indicator 11.6.2, Air quality in cities, for which WHO is custodial agency.
Type: Environmental
Cluster: Environmental Degradation
Hazard: Multi-hazard
Climate Central
Search: Coastal Risk Screening Tool
Search: Climate Central
Type: Exposure; Hazard
Interactive global map showing areas threatened by sea level rise and coastal flooding.
Type: Environmental; Meteorological and Hydrological
Cluster: Environmental Degradation; Flood
Hazard: Multi-hazard
Climate Central
Search: CoastalDEM® v2.1
Search: Climate Central
Type: Exposure; Hazard
Climate Central is pleased to announce the release of CoastalDEM® v2.1, a near-global digital elevation model for ocean coastal areas. CoastalDEM v2.1 has substantially reduced bias and error scatter even compared to its predecessor, CoastalDEM v1.1, making it the best-performing of all leading, publicly-available, global digital elevation models tested. CoastalDEM v2.1 is the result of substantial new investment, new neural network architecture, and additional and improved input datasets. CoastalDEM v2.1 now predicts corrections on land with elevations between -10 m and 120 m (CoastalDEM v1.1 was 1 - 20 m) making for much broader coverage of coastal areas.
Type: Environmental; Meteorological and Hydrological
Cluster: Environmental Degradation; Flood
Hazard: Multi-hazard
National Oceanic and Atmospheric Administration (NOAA)
Search: Global Drought Information System
Search: National Oceanic and Atmospheric Administration (NOAA)
Type: Exposure; Hazard
The Global Drought Information System (GDIS) is an international effort to pull together the best non-prescriptive drought information from local to national providers and provide an "apples to apples" comparison of drought conditions and resources from around the world. It is a tool for exploring global drought data and learning more about global drought resources, research and education.
Type: Meteorological and Hydrological
Cluster: Precipitation-Related
Hazard: Drought
National Oceanic and Atmospheric Administration (NOAA)
Search: National Integrated Drought Information System - International
Search: National Oceanic and Atmospheric Administration (NOAA)
Type: Exposure; Hazard
The maps, tools, and resources on this page address drought conditions around the world. On This Page: Global Drought Conditions, Key Impacts, Featured International Drought Maps, Tools for Visualizing and Analyzing Drought, Worldwide Humanitarian Alert Systems, International Drought Resources
Type: Meteorological and Hydrological
Cluster: Precipitation-Related
Hazard: Drought
Global Facility for Disaster Reduction and Recovery (GFDRR)
Search: Global Landslide Hazard Map
Search: Global Facility for Disaster Reduction and Recovery (GFDRR)
Type: Exposure; Hazard
The Global Landslide Hazard Map presents a qualitative representation of global landslide hazard at a global scale. It is the combination of the The Global Landslide Hazard Map: Median Annual Rainfall-Triggered Landslide Hazard (1980-2018) and The Global Landslide Hazard Map: Earthquake-Triggered Landslide Hazard which has then been simplified to four categories, ranging from Very low to High landslide hazard, based on the existing system used by ThinkHazard!
Type: Geohazards
Cluster: Other Geohazard; Seismogenic (Earthquakes); Volcanogenic
Hazard: Landslide (other trigger – not volc nor EQ); Landslide (Volcanic Trigger); Landslide or Debris Flow (Earthquake Trigger)
Global Facility for Disaster Reduction and Recovery (GFDRR)
Search: Global Landslide Hazard Map: Earthquake-Triggered Landslide Hazard
Search: Global Facility for Disaster Reduction and Recovery (GFDRR)
Type: Exposure; Hazard
The Global Landslide Hazard Map presents a qualitative representation of global landslide hazard at a global scale. This is the compontent Earthquake-Triggered Landslide Hazard, which has been simplified to four categories, ranging from Very low to High landslide hazard, based on the existing system used by ThinkHazard!
Type: Geohazards
Cluster: Other Geohazard; Seismogenic (Earthquakes)
Hazard: Landslide or Debris Flow (Earthquake Trigger)
University of Colorado Boulder
Search: Flood Observatory: Space-based measurement, mapping, and modeling of surface water for research, humanitarian, and water resources applications
Search: University of Colorado Boulder
Type: Exposure; Hazard
The Flood Observatory’s mission is to: 1) Acquire and preserve for public use a digital map record of the Earth’s changing surface water, including changes related to floods, droughts, wetlands, shorelines, lakes, and reservoirs. 2) Conduct remote sensing-based water measurement and mapping in “near real time” for humanitarian purposes. 3) Support and encourage operational uses of remote sensing-based surface water information. 4) Conduct scientific research making use of these data products.
Type: Meteorological and Hydrological
Cluster: Flood
World Resources Institute (WRI)
Search: Water Temperature and Salinity [Resource Watch]
Search: World Resources Institute (WRI)
Type: Exposure; Hazard
Water Temperature and Salinity are two products from the Hybrid Coordinate Ocean Model (HYCOM), created by the HYCOM Consortium, the National Ocean Partnership Program (NOPP), and the United States Global Ocean Data Assimilation Experiment (GODEA). HYCOM is a fully three dimensional, multivariate, variational ocean data assimilation system that produces simultaneous analyses of temperature, salinity, geopotential and vector velocity.
Type: Environmental; Meteorological and Hydrological
Cluster: Environmental Degradation; Temperature-Related
Hazard: Salinity
National Aeronautics and Space Administration (NASA)
Search: NASA Sea Level Change Portal: Observations from space [National Aeronautics and Space Administration]
Search: National Aeronautics and Space Administration (NASA)
Type: Exposure; Hazard
Advancing NASA sea level science and interdisciplinary research. NASA keeps track of sea level change and its causes from space.
Type: Environmental
Cluster: Environmental Degradation
Hazard: Sea Level Rise
National Aeronautics and Space Administration (NASA)
Search: Sea Level Projection Tool [NASA Sea Level Change Portal]
Search: National Aeronautics and Space Administration (NASA)
Type: Exposure; Hazard
The NASA Sea Level Projection Tool allows users to visualize and download global and local sea level projection data from the IPCC 6th Assessment Report (AR6). The goal of this tool is to provide easy and improved access and visualization to the consensus projections found in the report.
Type: Environmental
Cluster: Environmental Degradation
Hazard: Sea Level Rise
National Oceanic and Atmospheric Administration. (NOAA) National Centers for Environmental Information (NCEI)
Search: Wildfires
Search: National Oceanic and Atmospheric Administration. (NOAA) National Centers for Environmental Information (NCEI)
Type: Exposure; Hazard
Wildland fires are the fastest growing fire threat. To help mitigate this problem, the NESDIS Satellite Services Division (SSD) provides real time environmental satellite data and derived products including the Hazard Mapping System (HMS) Fire and Smoke Product and the Wildfire Automated Biomass Burning Algorithm (WFABBA) product. National Oceanic and Atmospheric Administration (NOAA) National Centers for Environmental Information (NCEI)
Type: Environmental
Cluster: Environmental Degradation (Forestry)
Hazard: Wildfires
Socioeconomic Data and Applications Center (SEDAC)
Search: SEDAC Hazards Mapper [Socioeconomic Data and Applications Center]
Search: Socioeconomic Data and Applications Center (SEDAC)
Type: Exposure; Hazard
SEDAC’s Hazards Mapper enables users to rapidly get an idea of the population, land area, dams, and nuclear power plants that could be impacted by a wide range of natural events, including floods, earthquakes, fires, and volcanic eruptions. The Hazards Mapper allows users to interface with numerous data sets we have that relate to hazards and exposure. SEDAC Gridded Population of the World v4, NASA EONET Curated Hazards Event List
European Commission (EC). Joint Research Centre (JRC)
Search: Global Flood Awareness System (GloFAS): global ensemble streamflow forecasting and flood forecasting
Search: European Commission (EC). Joint Research Centre (JRC)
Type: Exposure; Hazard
The Global Flood Awareness System (GloFAS) is one component of the Copernicus Management Service CEMS. It is designed to support preparatory measures for flood events worldwide, particularly in large trans-national river basins. To provide information on both ongoing and upcoming flood events, GloFAS combines information from satellites, models and in-situ measurements to produce: GloFAS forecasts, GloFAS Seasonal forecasts, GloFAS Impact Forecasts
Type: Meteorological and Hydrological
Cluster: Flood
Global Forest Watch (GFW)
Search: Global Deforestation and Statistics
Search: Global Forest Watch (GFW)
Type: Exposure; Hazard; Loss
Global Deforestation and Statistics data has interactive charts and maps that summarize global rates of forest change. Statistics including rankings of countries with the most forest loss and gain, and drivers of deforestation
Type: Environmental
Cluster: Environmental Degradation
Hazard: Deforestation; Forest Declines and Diebacks; Forest Disturbances
Global Earthquake Model (GEM) Foundation
Search: OpenQuake Map Viewer - Global Seismic Risk Map
Search: Global Earthquake Model (GEM) Foundation
Type: Exposure; Hazard; Loss
The Global Seismic Risk Map (v2018.1) presents the geographic distribution of average annual loss (USD) normalised by the average construction costs of the respective country (USD/m2) due to ground shaking in the residential, commercial and industrial building stock, considering contents, structural and non-structural components. The normalised metric allows a direct comparison of the risk between countries with widely different construction costs. It does not consider the effects of tsunamis, liquefaction, landslides, and fires following earthquakes.
Type: Geohazards
Cluster: Seismogenic (Earthquakes)
Hazard: Earthquake
World Resources Institute (WRI)
Search: Global Forest Watch
Search: World Resources Institute (WRI)
Type: Exposure; Hazard; Loss; Vulnerability
Thousands of people around the world use GFW every day to monitor and manage forests, stop illegal deforestation and fires, call out unsustainable activities, defend their land and resources, sustainably source commodities, and conduct research at the forefront of conservation.
Type: Environmental
Cluster: Environmental Degradation (Forestry)
Hazard: Multi-hazard
Global Forest Watch (GFW)
Search: Interactive World Forest Map and Tree Cover Change Data
Search: Global Forest Watch (GFW)
Type: Exposure; Hazard; Loss; Vulnerability
Explore interactive charts and maps that summarize global rates of forest change. Statistics – including rankings of countries with the most forest loss and gain, and drivers of deforestation – can be customized, easily shared and downloaded for offline use.
Type: Environmental
Cluster: Environmental Degradation (Forestry)
Hazard: Multi-hazard
United Nations Environment Programme (UNEP). Global Resource Information Database (GRID).
Search: World Environment Situation Room (WESR): Risk data Viewer; Global risk data platform.
Search: United Nations Environment Programme (UNEP). Global Resource Information Database (GRID).
Type: Exposure; Hazard; Loss; Vulnerability
This platform provides access to global datasets regarding hazards (floods, droughts, forest fires, tropical cyclones, earthquakes, tsunamis, landslides, volcanoes), the exposure (economic or population) as well as risk of losses (mortality and economic risk). Users can visualise, download or extract data on past hazardous events, human & economical hazard exposure and risk from natural hazards. The WESR-RISK Data Platform is a multiple agencies effort to share spatial data information on global risk from natural hazards. It is part of the MapX online platform for managing geospatial data on natural resources. Some of the data included here are available in near-real time, such as e.g. the detection of forest fires or earthquakes hazards.
Type: Meteorological and Hydrological; Geohazards; Environmental
Cluster: Flood; Seismogenic (Earthquakes); Volcanogenic (Volcanoes and Geothermal); Wind-Related; Marine; Environmental Degradation (Forestry)
Hazard: Multi-hazard
Floodbase
Search: Global Flood database
Search: Floodbase
Type: Exposure; Hazard; Loss; Vulnerability
The Global Flood Database is a satellite-based resource for global flood risk management and mitigation. It combines over 15 years of flood data and contains maps of 913 flood events that occurred between 2000 and 2018. The database is the first comprehensive resource for global flood risk management and mitigation. The Global Flood Monitor is another global flood monitor that uses Twitter to locate and detect floods in real-time. In 2020, approximately 34.2 million people worldwide were impacted by flooding, including being injured or losing their homes. In 2021, there were 223 flood disasters recorded worldwide.
Type: Meteorological and Hydrological
Cluster: Flood
Socioeconomic Data and Applications Center (SEDAC)
Search: Data sets [Socioeconomic Data and Applications Center (SEDAC)]
Search: Socioeconomic Data and Applications Center (SEDAC)
Type: Exposure; Hazard; Loss; Vulnerability
SEDAC, the Socioeconomic Data and Applications Center, is one of the Distributed Active Archive Centers (DAACs) in the Earth Observing System Data and Information System (EOSDIS) of the U.S. National Aeronautics and Space Administration. Focusing on human interactions in the environment, SEDAC has as its mission to develop and operate applications that support the integration of socioeconomic and earth science data and to serve as an "Information Gateway" between earth sciences and social sciences. The datasets and data collections cover a range of themes, namely Agriculture, Climate, Conservation, Governance, Hazards, Health, Infrastructure, Land Use, Marine and Coastal, Population, Poverty, Remote Sensing, Sustainability, Urban, and Water. Maps include a gallery, viewer, services, and mapping tools
Global Facility for Disaster Reduction and Recovery (GFDRR)
Search: Risk Data Library Standard (RDLS)
Search: Global Facility for Disaster Reduction and Recovery (GFDRR)
Type: Exposure; Hazard; Loss; Vulnerability
The Risk Data Library Standard (RDLS) is an open metadata standard for describing risk datasets used in climate and disaster risk assessments. The purpose of the RDLS is to enable risk reduction and resilience building by making it easier for risk data publishers to describe their datasets and for risk data users to identify datasets to use in their work. The key feature of the RDLS is the metadata standard for describing hazard, exposure, vulnerability, and loss datasets. In addition to the metadata standard, the RDLS provides guidance on packaging and formatting for risk datasets, although it does not seek to standardise the contents of risk datasets. The RDLS is curated by the Global Facility for Disaster Reduction and Recovery and is intended for use by anyone involved in publishing or using disaster risk data.
Global Facility for Disaster Reduction and Recovery (GFDRR); World Bank
Search: Risk Data Library
Search: Global Facility for Disaster Reduction and Recovery (GFDRR); World Bank
Type: Exposure; Hazard; Loss; Vulnerability
This collection contains data on disaster and climate risk assessments curated by the Global Facility for Disaster Reduction and Recovery (GFDRR).
Coalition for Disaster Resilient Infrastructure (CDRI); United Nations Environment Programme (UNEP). Global Resource Information Database (GRID).
Search: Global Infrastructure Risk Model and Resilience Index (GIRI): Measuring risk and resilience in infrastructure sectors (Beta version of the platform)
Search: Coalition for Disaster Resilient Infrastructure (CDRI); United Nations Environment Programme (UNEP). Global Resource Information Database (GRID).
Type: Exposure; Hazard; Loss; Vulnerability
The Global Infrastructure Risk Model and Index (GIRI) is the first publicly available, fully probabilistic risk model to estimate risk for infrastructure assets with respect to most major geological and climate-related hazards. The purpose of GIRI is to improve understanding and make visible the global landscape of infrastructure risk and resilience. GIRI can assist in the identification of the contingent liabilities internalised in each infrastructure sector and the implications for social and economic development. It can thus provide the basis for developing national resilience policies, strategies and plans, as well as resilience standards.
World Bank
Search: World Bank Open Data: Free and open access to global development data
Search: World Bank
Type: Exposure; Hazard; Loss; Vulnerability
This site is designed to make World Bank data easy to find, download, and use. All of the data found here can be used free of charge with minimal restrictions.
World Bank
Search: Data Catalogue [World Bank]
Search: World Bank
Type: Exposure; Hazard; Loss; Vulnerability
The Data Catalog is designed to make World Bank's development data easy to find, download, use, and share. It includes data from the World Bank's microdata, finances and energy data platforms, as well as datasets from the open data catalog
United Nations Office for the Coordination of Humanitarian Affairs (UN OCHA)
Search: Humanitarian Data Exchange (HDX): Find, share and use humanitarian data all in one place
Search: United Nations Office for the Coordination of Humanitarian Affairs (UN OCHA)
Type: Exposure; Hazard; Loss; Vulnerability
The Humanitarian Data Exchange (HDX) is an open platform for sharing data across crises and organisations. Launched in July 2014, the goal of HDX is to make humanitarian data easy to find and use for analysis. Our growing collection of datasets has been accessed by users in over 250 countries and territories.
World Bank
Search: PM2.5 air pollution, mean annual exposure (micrograms per cubic meter)
Search: World Bank
Type: Exposure; Hazard; Vulnerability
Population-weighted exposure to ambient PM2.5 pollution is defined as the average level of exposure of a nation's population to concentrations of suspended particles measuring less than 2.5 microns in aerodynamic diameter, which are capable of penetrating deep into the respiratory tract and causing severe health damage. Exposure is calculated by weighting mean annual concentrations of PM2.5 by population in both urban and rural areas.
Type: Environmental
Cluster: Environmental Degradation
Hazard: Air Pollution (Point Source)
European Commission (EC). Joint Research Centre (JRC)
Search: Global Drought Observatory (GDO)
Search: European Commission (EC). Joint Research Centre (JRC)
Type: Exposure; Hazard; Vulnerability
This system is the onset of a Global Drought Observatory (GDO) mainly targeting at emergency response issues. Focus is on a Map Viewer and an information rich report. GDO is developed by the team of the European Drought Observatory (EDO).
Type: Meteorological and Hydrological
Cluster: Precipitation-Related
Hazard: Drought
Global Earthquake Model (GEM) Foundation
Search: OpenQuake Map Viewer - Published maps
Search: Global Earthquake Model (GEM) Foundation
Type: Exposure; Hazard; Vulnerability
Maps comprise the Global Seismic Hazard Map, Global Seismic Risk Map, Global Building Exposure, Global Exposure Map, Global Economic Vulnerability, Global Human Vulnerability, and Global Recovery and Reconstruction. Global Earthquake Model (GEM)
Type: Geohazards
Cluster: Seismogenic (Earthquakes)
Hazard: Earthquake
Global Earthquake Model (GEM) Foundation
Search: Global Economic Vulnerability Map
Search: Global Earthquake Model (GEM) Foundation
Type: Exposure; Hazard; Vulnerability
Presents a composite index designed primarily to measure the potential for economic losses from earthquakes due to a country's macroeconomic exposure.
Type: Geohazards
Cluster: Seismogenic (Earthquakes)
Hazard: Earthquake
National Aeronautics and Space Administration (NASA)
Search: Fire Information for Resource Management System (FIRMS)
Search: National Aeronautics and Space Administration (NASA)
Type: Exposure; Hazard; Vulnerability
The Fire Information for Resource Management System (FIRMS) distributes Near Real-Time (NRT) active fire data from the Moderate Resolution Imaging Spectroradiometer (MODIS) aboard the Aqua and Terra satellites, and the Visible Infrared Imaging Radiometer Suite (VIIRS) aboard S-NPP, NOAA 20 and NOAA 21 (formally known as JPSS-1 and JPSS-2). Globally these data are available within 3 hours of satellite observation. The active fire / hotspot data can be viewed in FIRMS Fire Map or in NASA’s Worldview , delivered as email alerts or downloaded in the following formats: SHP, KML, TXT, WMS FIRMS is part of NASA’s Land, Atmosphere Near real-time Capability for EO (LANCE).
Type: Technological; Environmental
Cluster: Industrial Failure; Environmental Degradation (Forestry)
Hazard: Multi-hazard
World Health Organization (WHO)
Search: Household air pollution data [World Health Organization (WHO)]
Search: World Health Organization (WHO)
Type: Exposure; Hazard; Vulnerability
Data on household air pollution which is generated by household fuel combustion (e.g. when using solid, unclean or less clean fuels), leading to indoor air pollution and contributing to outdoor air pollution. Household air pollution is a public health threat and varies according to the level of development. Access to clean fuels is distributed unevenly across the globe. The data use the indicator 'proportion of population with primary reliance on clean fuels and technologies for cooking'.
Type: Environmental
Cluster: Environmental Degradation
Hazard: Household Air Pollution
Global Facility for Disaster Reduction and Recovery (GFDRR)
Search: Global Landslide Susceptibility Map
Search: Global Facility for Disaster Reduction and Recovery (GFDRR)
Type: Exposure; Hazard; Vulnerability
The global Landslide Hazard Assessment for Situational Awareness (LHASA) model is developed to provide situational awareness of landslide hazards for a wide range of users. Precipitation is a common trigger of landslides. The GPM Integrated Multi-satellitE Retrievals for GPM (IMERG) data shows recent precipitation, updated every thirty minutes. A LHASA landslide “nowcast” is created by comparing GPM data from the last seven days to the long-term precipitation record provided by the Tropical Rainfall Measuring Mission (TRMM) Multi-satellite Precipitation Analysis (TMPA). Because IMERG data is only available starting in 2014, the record of historical rainfall was established by TMPA, comparing 2001-present.
Type: Geohazards
Cluster: Other Geohazard
Hazard: Landslide (other trigger – not volc nor EQ)
United Nations Environment Programme (UNEP). Global Resource Information Database (GRID).
Search: Global Resource Information Database (GRID) Geneva
Search: United Nations Environment Programme (UNEP). Global Resource Information Database (GRID).
Type: Exposure; Hazard; Vulnerability
The Global Resource Information Database - Geneva (GRID-Geneva), is a partnership between the United Nations Environment Programme (UNEP), the Swiss Federal Office for the Environment (FOEN) and the University of Geneva (UniGe). GRID-Geneva's main role is to transform data into information and knowledge to support the decision making process related to environmental issues. As part of its mission to transform data into scientifically validated information in support of environmental early warnings and assessments for sustainable development, UNEP/GRID-Geneva works in priority in the environment-related themes. This includes Biodiversity, Climate Change, Water, Energy, Pollution, Land Cover, Disaster Risk Reduction, Extractives, Planetary Boundaries, Youth and Environment, Gender and Environment, and Indigenous Knowledge.
United Nations Environment Programme (UNEP). Global Resource Information Database (GRID).
Search: MapX: an online platform for managing and visualizing geospatial data on natural resources
Search: United Nations Environment Programme (UNEP). Global Resource Information Database (GRID).
Type: Exposure; Hazard; Vulnerability
MapX is an online platform for managing and visualizing geospatial data on natural resources, developed by UNEP/GRID-Geneva, a data centre resulting from the partnership between UN Environment Programme, the Swiss Federal Office for the Environment, and the University of Geneva. Field applications of MapX are varied and include biodiversity planning, chemicals management, climate change, disaster risk reduction, environmental security, extractive industries, land use planning, and renewable energy, but they are not limited to these topics. MapX targets a wide community of users that are primarily UNEP, the Secretariats of Multilateral Environmental Agreements (MEAs) and other UN agencies mandated to collect and use geospatial data in environmental decision making. Civil society groups, non-governmental organizations, academia and citizens complement this set of users. MapX was designed in 2014 and since then continuously improved with wide international stakeholder consultations.
University of New South Wales
Search: Climdex: Explore, download and analyse indices of observed and modelled climate extremes
Search: University of New South Wales
Type: Exposure; Hazard; Vulnerability
Climdex allows user to explore, download and analyse indices of global observed climate extremes derived from daily temperature and precipitation data. Users can download data and plot maps and time series of gridded and station data from a range of sources. The Climdex indices can help us understand patterns in temperature and precipitation extremes: how they change from year to year or from place to place. Climdex offers a range of indices, all derived from daily temperature and precipitation data. These indices are a standardised set originally recommended by the CCl/WCRP/JCOMM Expert Team on Climate Change Detection and Indices (ETCCDI) which have been expanded upon by other World Meteorological Organisation (WMO) and World Climate Research Programme (WCRP) projects.
Type: Meteorological and Hydrological
World Health Organization's (WHO)
Search: Global Health Observatory (GHO) [World Health Organization (WHO)]
Search: World Health Organization's (WHO)
Type: Exposure; Vulnerability
The GHO data repository is WHO's gateway to health-related statistics for its 194 Member States. It provides access to over 1000 indicators on priority health topics including mortality and burden of diseases, the Millennium Development Goals (child nutrition, child health, maternal and reproductive health, immunization, HIV/AIDS, tuberculosis, malaria, neglected diseases, water and sanitation), non communicable diseases and risk factors, epidemic-prone diseases, health systems, environmental health, violence and injuries, equity among others.
Hazard: No HIPs Specific Hazard for Health
United Nations Development Programme (UNDP)
Search: Human development data: Human Development Reports - Data Center
Search: United Nations Development Programme (UNDP)
Type: Exposure; Vulnerability
Global, regional, and country/territory-level data on key dimensions of human development, with interactive insights and publications. The human development data are globally comparable, linked to the Sustainable Development Goals (SDGs), and sourced from international data agencies with the mandate, resources, and expertise to collect national data on specific indicators unless otherwise noted.
United Nations Development Programme (UNDP)
Search: Gender Inequality Index (GII)
Search: United Nations Development Programme (UNDP)
Type: Exposure; Vulnerability
Gender Inequality Index (GII) shows the loss in potential human development due to disparity bwtween female and male achievements in three dimensions: reproductive health, empowerment and the labour market. A low GII value indicates low inequality between women and men, and vice-versa. It ranges from 0, where women and men fare equally, to 1, where one gender fares as poorly as possible in all measured dimensions.
United Nations Development Programme (UNDP)
Search: Gender Development Index (GDI)
Search: United Nations Development Programme (UNDP)
Type: Exposure; Vulnerability
GDI measures gender inequalities in achievement in three basic dimensions of human development: health, education and economic resources.
WorldPop research programme; University of Southampton; School of Geography and Environmental Sciences
Search: WorldPop Hub
Search: WorldPop research programme; University of Southampton; School of Geography and Environmental Sciences
Type: Exposure; Vulnerability
Open spatial demographic data and research. WorldPop develops peer-reviewed research and methods for the construction of open and high-resolution geospatial data on population distributions, demographic and dynamics, with a focus on low and middle income countries.
Global Facility for Disaster Reduction and Recovery (GFDRR)
Search: GFDRR GeoNode: Open data to further your understanding of disaster risk
Search: Global Facility for Disaster Reduction and Recovery (GFDRR)
Type: Hazard
We maintain a curation of hazard datasets at the global and country level. Tools like ThinkHazard! use these datasets in the backend. Coastal Flood 20 datasets; Drought 35 datasets; Earthquake 141 datasets; Extreme Heat 4 datasets; Landslide 10 datasets; River Flood 167 datasets; Strong Wind 76 datasets; Tsunami 23 datasets; Volcanic 34 datasets; Wildfire 3 datasets
Hazard: Multi-hazard
United States Geological Survey (USGS)
Search: USGS data [United States Geological Survey]
Search: United States Geological Survey (USGS)
Type: Hazard
Browse real-time data, data releases and more.
Type: Geohazards
Earth Observation Research Center; Japan Aerospace Exploration Agency (JAXA)
Search: JAXA/ EORC Tropical Cyclones database [Japan Aerospace Exploration Agency, Earth Observation Research Center]
Search: Earth Observation Research Center; Japan Aerospace Exploration Agency (JAXA)
Type: Hazard
This site is a database of typhoons (tropical cyclones such as typhoons, hurricanes, and cyclones) occurring around the world. The database provides information on the duration and path of typhoons, as well as the maximum wind speed for each region. In addition, the data are extracted from earth observation satellites such as TRMM/PR, TMI, VIRS, GPM/KuPR, GMI, GCOM-W/AMSR2, Aqua/AMSR-E, Midori-II /AMSR. Physical quantities such as precipitation and water vapor, etc. are also included in this database.
Type: Meteorological and Hydrological
Cluster: Pressure-Related
Hazard: Depression or Cyclone (Low Pressure Area)
Global Earthquake Model (GEM) Foundation
Search: OpenQuake Map Viewer - Global Seismic Hazard Map
Search: Global Earthquake Model (GEM) Foundation
Type: Hazard
The Global Earthquake Model (GEM) Global Seismic Hazard Map (version 2018.1) depicts the geographic distribution of the Peak Ground Acceleration (PGA) with a 10% probability of being exceeded in 50 years, computed for reference rock conditions (shear wave velocity, VS30, of 760-800 m/s). The map was created by collating maps computed using national and regional probabilistic seismic hazard models developed by various institutions and projects, and by GEM Foundation scientists. The OpenQuake engine, an open-source seismic hazard and risk calculation software developed principally by the GEM Foundation, was used to calculate the hazard values.
Type: Geohazards
Cluster: Seismogenic (Earthquakes)
Hazard: Earthquake
Global Earthquake Model (GEM) Foundation
Search: OpenQuake Map Viewer - Global Seismic Hazard Map 2023.1 vs 2019.1
Search: Global Earthquake Model (GEM) Foundation
Type: Hazard
The Global Earthquake Model (GEM) Global Seismic Hazard Map (version 2023.1) depicts the geographic distribution of the Peak Ground Acceleration (PGA) with a 10% probability of being exceeded in 50 years, computed for reference rock conditions (shear wave velocity, Vs30 , of 760-800 m/s). The map was created by collating maps computed using national and regional probabilistic seismic hazard models developed by various institutions and projects, in collaboration with GEM Foundation scientists. By default this interactive map viewer presents the 2023.1 map on the right hand side of the comparison pane with the 2019.1 version on the left hand side.
Type: Geohazards
Cluster: Seismogenic (Earthquakes)
Hazard: Earthquake
Oasis Hub; Insurance Development Forum (IDF) Risk Modelling Steering Group (RMSG)
Search: CatRiskTools: A global catalogue of catastrophe risk analysis tools
Search: Oasis Hub; Insurance Development Forum (IDF) Risk Modelling Steering Group (RMSG)
Type: Hazard
Catrisktools provides a free and open access global directory of catastrophe risk assessment tools. It provides a comprehensive listing of available tools, with information on key attributes to help a potential user assess their applicability to the problem they are trying to solve. This includes the perils and countries they cover, tool capabilities, and links to providers’ websites. Commercial and non-commercial tools are included. The directory can be searched by country, peril, and license type.
National Oceanic and Atmospheric Administration. (NOAA) National Centers for Environmental Information (NCEI)
Search: NCEI/WDS Global Significant Earthquake Database, 2150 BC to Present [National Centers for Environmental Information (NCEI) / World Data Service (WDS)]
Search: National Oceanic and Atmospheric Administration. (NOAA) National Centers for Environmental Information (NCEI)
Type: Hazard; Loss
The Significant Earthquake Database is a global listing of over 5,700 earthquakes from 2150 BC to the present. A significant earthquake is classified as one that meets at least one of the following criteria: caused deaths, caused moderate damage (approximately $1 million or more), magnitude 7.5 or greater, Modified Mercalli Intensity (MMI) X or greater, or the earthquake generated a tsunami. The database provides information on the date and time of occurrence, latitude and longitude, focal depth, magnitude, maximum MMI intensity, and socio-economic data such as the total number of casualties, injuries, houses destroyed, and houses damaged, and $ dollage damage estimates. References, political geography, and additional comments are also provided for each earthquake. If the earthquake was associated with a tsunami or volcanic eruption, it is flagged and linked to the related tsunami event or significant volcanic eruption.
Type: Geohazards
Cluster: Seismogenic (Earthquakes)
Hazard: Earthquake
National Oceanic and Atmospheric Administration (NOAA). National Centers for Environmental Information (NCEI)
Search: Natural Hazards Viewer
Search: National Oceanic and Atmospheric Administration (NOAA). National Centers for Environmental Information (NCEI)
Type: Hazard; Loss
NCEI archives and assimilates tsunami, earthquake and volcano data to support research, planning, response and mitigation. Long-term data, including photographs, can be used to establish the history of natural hazard occurrences and help mitigate against future events.
Hazard: Multi-hazard
University of Colorado Boulder
Search: Dartmouth Flood Observatory (DFO): Global active archive of large flood events, 1985 - present
Search: University of Colorado Boulder
Type: Hazard; Loss
The information presented in this Archive is derived from news, governmental, instrumental, and remote sensing sources. The archive is "active" because current events are continually being added.
Type: Meteorological and Hydrological
Cluster: Flood
National Oceanic and Atmospheric Administration. (NOAA) National Centers for Environmental Information (NCEI)
Search: NCEI/WDS Global Significant Volcanic Eruptions Database, 4360 BC to Present [National Centers for Environmental Information (NCEI) / World Data Service (WDS)]
Search: National Oceanic and Atmospheric Administration. (NOAA) National Centers for Environmental Information (NCEI)
Type: Hazard; Loss
The Significant Volcanic Eruptions Database is a global listing of over 600 eruptions from 4360 BC to the present. A significant eruption is classified as one that meets at least one of the following criteria: caused fatalities, caused moderate damage (approximately $1 million or more), Volcanic Explosivity Index (VEI) of 6 or greater, generated a tsunami, or was associated with a significant earthquake. The database provides information on the latitude, longitude, elevation, type of volcano, last known eruption, VEI index, and socio-economic data such as the total number of casualties, injuries, houses destroyed, and houses damaged, and $ dollage damage estimates. References, political geography, and additional comments are also provided for each eruption. If the eruption was associated with a tsunami or significant earthquake, it is flagged and linked to the related database.
Type: Geohazards
Cluster: Volcanogenic (Volcanoes and Geothermal)
National Oceanic and Atmospheric Administration (NOAA). National Centers for Environmental Information (NCEI)
Search: National Geophysical Data Center / World Data Service: NCEI/WDS Global Historical Tsunami Database, 2100 BC to Present [National Centers for Environmental Information (NCEI) / World Data Service (WDS)]
Search: National Oceanic and Atmospheric Administration (NOAA). National Centers for Environmental Information (NCEI)
Type: Hazard; Loss
The Global Historical Tsunami Database provides information on over 2,400 tsunamis from 2100 BC to the present in the the Atlantic, Indian, and Pacific Oceans; and the Mediterranean and Caribbean Seas. The database includes two related files. The first file includes information on the tsunami source such as the date, time, and location of the source event; cause and validity of the source, tsunami magnitude and intensity; maximum water height; the total number of fatalities, injuries, houses destroyed, and houses damaged; and total damage estimate (in U.S. dollars). The second related file contains information on the runups (the locations where tsunami waves were observed by eyewitnesses, reconnaissance surveys, tide gauges, and deep-ocean sensors) such as name, location, arrival time, maximum water height and inundation distance, and socio-economic data (deaths, injuries, damage) for the specific runup location.
Type: Meteorological and Hydrological
Cluster: Marine
Hazard: Tsunami
National Oceanic and Atmospheric Administration (NOAA). National Centers for Environmental Information (NCEI)
Search: Tsunami Events (1850 to Present) Time-Lapse Animation
Search: National Oceanic and Atmospheric Administration (NOAA). National Centers for Environmental Information (NCEI)
Type: Hazard; Loss
This is an animated, interactive map displaying global historical tsunami events from the Global Historical Tsunami Database at NOAA's National Centers for Environmental Information (NCEI). Tsunami events with low validities (1=very doubtful tsunami) to high validities (4=definite tsunami) are displayed. The tsunami events were gathered from scientific and scholarly sources, regional and worldwide catalogs, tide gauge data, deep ocean sensor data, individual event reports, and unpublished works. To view all global historical tsunami events from 2000 B.C. to the present, please visit the Global Historical Tsunami Database or view the NCEI Natural Hazards Interactive Map Viewer. National Oceanic and Atmospheric Administration (NOAA) National Centers for Environmental Information (NCEI)
Hazard: Tsunamis caused by: Earthquakes, volcanoes, landslides and others
Global Earthquake Model (GEM) Foundation
Search: OpenQuake Map Viewer - Social Vulnerability (SV) Global - Economic Vulnerability
Search: Global Earthquake Model (GEM) Foundation
Type: Hazard; Vulnerability
The Global Economic Vulnerability Map is a composite index that was designed primarily to measure the potential for economic losses from earthquakes due to a country’s macroeconomic exposure. This index is also an appraisal of the ability of countries to respond to shocks to their economic systems. Relevant indicators include the density of exposed economic assets such as commercial and industrial infrastructure. Metrics used to measure the ability of a country to withstand shocks to its economic system include reliance on imports/exports, government debt, and purchasing power.
Type: Geohazards
Cluster: Seismogenic (Earthquakes)
Hazard: Earthquake
Global Earthquake Model (GEM) Foundation
Search: OpenQuake Map Viewer - Social Vulnerability (SV) Global - Human Vulnerability
Search: Global Earthquake Model (GEM) Foundation
Type: Hazard; Vulnerability
The Global Social Vulnerability Map is a composite index that was developed to measure characteristics or qualities of social systems that create the potential for loss or harm. Here, social vulnerability helps to explain why some countries will experience adverse impacts from earthquakes differentially where the linking of social capacities with demographic attributes suggests that communities with higher percentages of age-dependent populations, homeless, disabled, under-educated, and foreign migrants are likely to exhibit higher social vulnerability than communities lacking these characteristics. Other relevant factors that affect the social vulnerability of populations include in-migration from foreign countries, population density, an accounting of slum populations, and international tourist arrivals.
Type: Geohazards
Cluster: Seismogenic (Earthquakes)
Hazard: Earthquake
Asian Disaster Reduction Center (ADRC)
Search: GLobal IDEntifier Number (GLIDE)
Search: Asian Disaster Reduction Center (ADRC)
Type: Loss
Since the beginning of 2004, GLobal IDEntifier numbers (GLIDE), a globally common Unique ID code for disasters, are produced by this website (GLIDEnumber.net) for all new disaster events reported by partner institutions and those discovered by ADRC. GLIDEnumber.net, and the GLIDE generator are intended to facilitate linkages between records in diverse disaster databases.
Hazard: Multi-hazard
United Nations Office for Disaster Risk Reduction (UNDRR)
Search: DesInventar
Search: United Nations Office for Disaster Risk Reduction (UNDRR)
Type: Loss
Disaster loss data for Sustainable Development Goals and Sendai Framework Monitoring System. DesInventar is a conceptual and methodological tool for the generation of National Disaster Inventories and the construction of databases of damage, losses and in general the effects of disasters.
Hazard: Multi-hazard
World Resources Institute (WRI)
Search: Biodiversity Intactness [Resource Watch]
Search: World Resources Institute (WRI)
Type: Loss
Biodiversity Intactness modeled average abundance of originally present species, relative to their abundance in an intact ecosystem after land use change or human impacts. The biodiversity intactness map shows global estimates of how land use pressures have affected the numbers of species and individuals found in an area. This data is important because if biodiversity loss goes unchecked, it will undermine efforts toward long-term sustainable development. The data, created by Newbold et al. (2016), represents intactness in 2005 at a 1 kilometer resolution.
Type: Environmental
Cluster: Environmental Degradation
Hazard: Biodiversity Loss
Centre for Research on the Epidemiology of Disasters (CRED)
Search: Emergency Events Database (EM-DAT)
Search: Centre for Research on the Epidemiology of Disasters (CRED)
Type: Loss
EM-DAT contains data on the occurrence and impacts of over 26,000 mass disasters worldwide from 1900 to the present day. The database is compiled from various sources, including UN agencies, non-governmental organizations, reinsurance companies, research institutes, and press agencies. The Centre for Research on the Epidemiology of Disasters (CRED) distributes the data in open access for non-commercial use.
Hazard: Multi-hazard
Socioeconomic Data and Applications Center (SEDAC)
Search: Geocoded Disasters (GDIS) Dataset, v1 (1960 – 2018) [Socioeconomic Data and Applications Center (SEDAC)]
Search: Socioeconomic Data and Applications Center (SEDAC)
Type: Loss
The Geocoded Disasters (GDIS) Dataset is a geocoded extension of a selection of natural disasters from the Centre for Research on the Epidemiology of Disasters' (CRED) Emergency Events Database (EM-DAT). The data set encompasses 39,953 locations for 9,924 disasters that occurred worldwide in the years 1960 to 2018. All floods, storms (typhoons, monsoons etc.), earthquakes, landslides, droughts, volcanic activity and extreme temperatures that were recorded in EM-DAT during these 58 years and could be geocoded are included in the data set. The highest spatial resolution in the data set corresponds to administrative level 3 (usually district / commune / village) in the Global Administrative Areas database (GADM, 2018). The vast majority of the locations are administrative level 1 (typically state / province / region).
Type: Biological; Chemical; Environmental; Extraterrestrial; Geohazards; Meteorological and Hydrological; Societal; Technological
Oasis Hub; Insurance Devlopment Forum
Search: Oasis Loss Modelling Framework
Search: Oasis Hub; Insurance Devlopment Forum
Type: Loss
The Oasis Loss Modelling Framework provides an open source platform for developing, deploying and executing catastrophe models. It uses a full simulation engine and makes no restrictions on the modelling approach.
Oasis Hub; Insurance Devlopment Forum
Search: Open Results Data (ORD) [standard]
Search: Oasis Hub; Insurance Devlopment Forum
Type: Loss
Like OED, the purpose of ORD is to ensure model outputs are consistent, transparent, and model agnostic. The ORD package is intended to contain the outputs of all current catastrophe models and to be extensible to cope with future developments. The ORD outputs are results tables that capture all of the possible data that a model could produce.
World Health Organization (WHO)
Search: Mortality Database [World Health Organization (WHO)]
Search: World Health Organization (WHO)
Type: Loss; Vulnerability
The WHO Mortality Database is a compilation of mortality data by country and area, year, sex, age and cause of death, as transmitted annually by national authorities from their civil registration and vital statistics system. It comprises data since 1950 to date. The WHO Mortality Database is the leading data source for comparative epidemiological studies of mortality by cause. The visualization portal gives unprecedented impact, accessibility and relevance and provides export facilities for cause-of-death data.
United Nations Children's Fund (UNICEF)
Search: UNICEF data: Child Statistics
Search: United Nations Children's Fund (UNICEF)
Type: Vulnerability
Monitoring the situation of children and women. UNICEF’s Data Team is the global go-to for data on children. It leads the collection, validation, analysis, use and communication of the most statistically sound, internationally comparable data on the situation of children and women around the world. The team upholds the quality, integrity and organization of these data and makes them accessible as a global public good on the data.unicef.org website.
University of Notre Dame
Search: ND-GAIN Country Index [Notre Dame Global Adaptation Initiative]
Search: University of Notre Dame
Type: Vulnerability
The ND-GAIN Country Index summarizes a country's vulnerability to climate change and other global challenges in combination with its readiness to improve resilience.
International Institute of Seismology and Earthquake Engineering (IISEE), Building Research Institute
Search: Catalog of Damaging Earthquakes in the World (Through 2019) [Utsu Catalog]
Search: International Institute of Seismology and Earthquake Engineering (IISEE), Building Research Institute
Type: Hazard; Loss
The Utsu catalog is a catalog of deadly earthquakes. It's also known as the "Catalog of Damaging Earthquakes in the World". Dr. Tokuji Utsu, a Professor Emeritus of Tokyo University, has been compiling the catalog. The catalog contains more than 10000 damaging earthquakes in the world from 3000 B.C.
Type: Geohazards
Cluster: Seismogenic (Earthquakes)
Hazard: Earthquake
United States Geological Survey (USGS)
Search: PAGER [Prompt Assessment of Global Earthquakes for Response]
Search: United States Geological Survey (USGS)
Type: Exposure; Hazard; Loss; Vulnerability
The PAGER (Prompt Assessment of Global Earthquakes for Response) system provides fatality and economic loss impact estimates following significant earthquakes worldwide. Since the PAGER loss estimations are available well in advance of ground-truth observations or news accounts, they can play a primary alerting role for domestic as well as international earthquake disasters. USGS Earthquake Hazards Program, responsible for monitoring, reporting, and researching earthquakes and earthquake hazards.
Type: Geohazards
Cluster: Seismogenic (Earthquakes)
Hazard: Earthquake
European Commission (EC). Copernicus
Search: Copernicus Emergency Management Service (CEMS)
Search: European Commission (EC). Copernicus
Type: Exposure; Hazard; Vulnerability
Information for emergency response and disaster risk management. The Copernicus Emergency Management Service (CEMS) supports all actors involved in the management of natural or manmade disasters by providing geospatial data and images for informed decision making. Services include on demand mapping, exposure mapping, early warning and monitoring with critical geospatial information at European and global level through continuous observations and forecasts for floods, droughts and forest fires. CEMS products are created using satellite, in-situ (non-space) and model data.
Hazard: Multi-hazard
GAPHAZ - Glacier and Permafrost Hazards
Search: GAPHAZ - Glacier and Permafrost Hazards
Search: GAPHAZ - Glacier and Permafrost Hazards
Type: Hazard
This database is a selection and overview of typical glacier and permafrost disasters in mountains. The database is by no means complete, nor are the disaster descriptions complete. The present version is an initial test version. We appreciate any corrections and extensions for included cases, and additional cases (see next section). The database is ment to improve process understanding by providing parameters of cases and the type of processes involved in these cases. The database is neither suitable for assessing hazards in individual cases nor for any disaster forecasting. Individual case histories can be dangerously misleading when used for hazard assessment at the same site because the relevant local conditions may have changed substantially.
Type: Meteorological and Hydrological
Cluster: Temperature-Related
National Aeronautics and Space Administration (NASA)
Search: Landslides @ NASA [including NASA Landslide Viewer]
Search: National Aeronautics and Space Administration (NASA)
Type: Hazard
The Cooperative Open Online Landslide Repository (COOLR) project provides an open platform where scientists and citizen scientists around the world can share landslide reports to guide awareness of landslide hazards for improving scientific modeling and emergency response. Scientists and citizen scientists can submit landslides to the Landslide Reporter web application, or submit landslide inventories directly to us. All the data submitted is made available on the data portal Landslide Viewer, which shows referenced and imported landslide inventories from all over the world.
Type: Geohazards
Hazard: Multi-hazard
University of Sheffield
Search: Global Fatal Landslide Database (GFLD)
Search: University of Sheffield
Type: Hazard; Loss
The Global Fatal Landslide Database (GFLD) has been consistently collected and maintained since 2004. This version of the dataset contains all non-seismically triggered fatal landslide events from 2004 to 2016. The data were analysed in Froude and Petley, 10.5194/nhess-18-2161-2018. Further details are provided in this publication which is open source. The University of Sheffield
Type: Geohazards
Hazard: Multi-hazard
World Resources Institute (WRI)
Search: Erosion Risk: Erosion risk from sheet and rill erosion from rainfall and associated runoff [Resource Watch]
Search: World Resources Institute (WRI)
Type: Hazard
This layer shows the risk of erosion around the world, from low to high. The Revised Universal Soil Loss Equation (RUSLE), which predicts annual soil loss from rainfall and runoff, is the most common model used at large spatial scales due to its relatively simple structure and empirical basis. The model takes into account rainfall erosivity, topography, soil erodibility, land cover and management, and conservation practices. Erosion and sedimentation by water involves the process of detachment, transport, and deposition of soil particles, driven by forces from raindrops and water flowing over the land surface. Because soil erosion is difficult to measure at large scales, soil erosion models are crucial estimation tools to extrapolate limited data to other localities and conditions.
Type: Environmental
Cluster: Environmental Degradation
Hazard: Soil Erosion
Joint Research Centre of the European Commission (JRC); United Nations Office for Coordination of Humanitarian Affairs (UN OCHA); United Nations Satellite Centre (UNOSAT)
Search: Global Disaster Alert and Coordination System (GDACS)
Search: Joint Research Centre of the European Commission (JRC); United Nations Office for Coordination of Humanitarian Affairs (UN OCHA); United Nations Satellite Centre (UNOSAT)
Type: Hazard; Loss
The Global Disaster Alert and Coordination System (GDACS) was created in 2004 as a cooperation framework between the United Nations and the European Commission, in order to address significant gaps in information collection and analysis in the early phase of major sudden-onset disasters. Currently GDACS alerts are issued for earthquakes and possible subsequent tsunamis, tropical cyclones, floods and volcanoes.
European Commission (EC). Joint Research Centre (JRC)
Search: Global Wildfire Information System (GWIS)
Search: European Commission (EC). Joint Research Centre (JRC)
Type: Exposure; Hazard; Vulnerability
GWIS aims at bringing together existing information sources at regional and national level in order to provide a comprehensive view and evaluation of fire regimes and fire effects at global to national level and to provide tools to support operational.
Type: Environmental
Cluster: Environmental Degradation (Forestry)
Hazard: Wildfires
European Commission (EC). Joint Research Centre (JRC)
Search: European Forest Fire Information System - EFFIS
Search: European Commission (EC). Joint Research Centre (JRC)
Type: Exposure; Hazard; Loss; Vulnerability
EFFIS supports the services in charge of the protection of forests against fires in the EU and neighbor countries and provides the European Commission services and the European Parliament with updated and reliable information on wildfires in Europe. The fires mapped in EFFIS may include fires set intentionally for the purpose of vegetation management.
Type: Environmental
Cluster: Environmental Degradation (Forestry)
Hazard: Wildfires
University of Maryland (UMD)
Search: Global Fire Emissions Database (GFED)
Search: University of Maryland (UMD)
Type: Exposure; Hazard; Loss
We have combined satellite information on fire activity and vegetation productivity to estimate gridded monthly burned area and fire emissions, as well as scalars that can be used to calculate higher temporal resolution emissions. Most of the resulting datasets are downloadable from this website for use in large-scale atmospheric and biogeochemical studies. The current version is 4 which has a spatial resolution of 0.25 degrees and is available from 1997 onwards. The most recent year is 2016 but monthly emissions are available for the period after 2016 (article in review).
Type: Environmental
Cluster: Environmental Degradation (Forestry)
Hazard: Wildfires
World Resources Institute (WRI)
Search: Resource Watch: Monitoring the Planet’s Pulse
Search: World Resources Institute (WRI)
Type: Exposure; Hazard; Loss; Vulnerability
Resource Watch provides trusted and timely data for a sustainable future. Resource Watch is a dynamic platform that provides trusted and timely data for a sustainable future. Resource Watch features hundreds of data sets all in one place on the state of the planet’s resources and citizens. Users can visualize challenges facing people and the planet, from climate change to poverty, water risk to state instability, air pollution to human migration, and more. Resource Watch is currently in Beta, and we’re dedicated to growing it and making it stronger every day. We will be regularly adding new data sets, functionality, and blogs.
Oasis Hub; Insurance Devlopment Forum
Search: Oasis Hub [including Oasis Hub Data]
Search: Oasis Hub; Insurance Devlopment Forum
Type: Exposure; Hazard; Loss; Vulnerability
Oasis Hub was launched in June 2017, as an aggregator for catastrophe, extreme weather and environmental risk data, tools & services, as well to provide data set enhancement, development and data aggregation services. The key driver & focus was to create an open, transparent, data platform that would inevitably help provide environmental, climate change and catastrophe risk information to business and wider society, whilst providing everyone with a platform that encourages collaboration and crossover around data and services. The Hub provides our members with over 1500+ free & commercially licensable catastrophe & environmental risk datasets sourced from over 165 environmental data providers around the world.
World Resources Institute (WRI)
Search: Aqueduct: Using cutting-edge data to identify and evaluate water risks around the world [World Resources Institute (WRI)]
Search: World Resources Institute (WRI)
Type: Exposure; Hazard; Vulnerability
The Aqueduct tools enable users to measure, map, and mitigate water risks around the world with its open-source, and high-resolution platform. It uses multiple data layers to display water risks at any given location. Current water risks can be compared to those in the future, to visualize trends for optimistic, pessimistic, or business-as-usual climate and growth scenarios. Aqueduct’s data is used to evaluate water risks, set targets, inform smart water policies, and assess the costs and benefits of water management strategies.
Eidgenössische Technische Hochschule Zürich (ETHZ)
Search: CLIMADA Economics of Climate Adaptation
Search: Eidgenössische Technische Hochschule Zürich (ETHZ)
Type: Exposure; Hazard; Loss; Vulnerability
Using state-of-the-art probabilistic modelling, CLIMADA allows to estimate the expected economic damage as a measure of risk today, the incremental increase from economic growth and the further incremental increase due to climate change (see infograph below). CLIMADA provides global coverage of major climate-related extreme-weather hazards at high resolution via a data API, namely (i) tropical cyclones, (ii) river flood, (iii) agro drought and (iv) European winter storms, all at 4km spatial. For all hazards, historic and probabilistic event sets exist, for some also under select climate forcing scenarios (RCPs) at distinct time horizons (e.g. 2040). The economics of climate adaptation methodology as implemented in CLIMADA provides decision makers with a fact base to understand the impact of weather and climate on their economies, including cost/benefit perspectives on specific risk reduction measures.
European Commission (EC). Copernicus
Search: Global Human Settlement Layer (GHSL): Open and free data and tools for assessing the human presence on the planet
Search: European Commission (EC). Copernicus
Type: Exposure
The Global Human Settlement Layer (GHSL) project produces global spatial information about the human presence on the planet over time. This in the form of built-up maps, population density maps and settlement maps. This information is generated with evidence-based analytics and knowledge using new spatial data mining technologies. The GHSL processing framework uses heterogeneous data including global archives of fine-scale satellite imagery, census data, and volunteered geographic information. The data is processed fully automatically and generates analytics and knowledge reporting objectively and systematically about the presence of population and built-up infrastructures.
European Commission (EC). Joint Research Centre (JRC)
Search: INFORM Subnational Risk
Search: European Commission (EC). Joint Research Centre (JRC)
Type: Exposure; Hazard; Vulnerability
An INFORM Subnational risk index shows a detailed picture of risk and its components within a single region or country. It uses the same methodology and development process as the global INFORM, but is subnational in resolution. Developing an INFORM Subnational model is a locally owned and managed, cost-effective process that is supported by the global INFORM initiative.
Food and Agriculture Organization of the United Nations (FAO)
Search: AQUASTAT Dissemination System [Food and Agriculture Organization of the United Nations (FAO)]
Search: Food and Agriculture Organization of the United Nations (FAO)
Type: Exposure; Loss
AQUASTAT is the FAO global information system on water resources and agricultural water management. It collects, analyses and provides free access to over 180 variables and indicators by country from 1960. AQUASTAT draws on national capacities and expertise with an emphasis on Africa, the Near East, countries of the former Soviet Union, Asia, and Latin America and the Caribbean. AQUASTAT plays a key role in the monitoring of the Sustainable Development Goal 6 that sets out to "ensure availability and sustainable management of water and sanitation for all", and in particular indicators of target 6.4 on water stress and water use efficiency.
Food and Agriculture Organization of the United Nations (FAO)
Search: AQUASTAT Climate Information Tool
Search: Food and Agriculture Organization of the United Nations (FAO)
Type: Exposure; Loss
AQUASTAT is FAO’s global water information system, known to be the most quoted source on global water statistics. It collects, analyses and disseminates data and information by country, by region and for the world. Provided data is supplemented with a state-of-the-art contextual metadata system which gives related information exactly where it is required.
Food and Agriculture Organization of the United Nations (FAO)
Search: System for Earth Observation Data Access, Processing and Analysis for Land Monitoring (SEPAL)
Search: Food and Agriculture Organization of the United Nations (FAO)
The System for Earth Observation Data Access, Processing and Analysis for Land Monitoring (SEPAL) is an open-source project and platform empowering people around the world to gain a better understanding of land cover dynamics by facilitating the efficient access and use of Earth observation data – without the need of coding knowledge. It helps countries monitor and report on forests and land use. SEPAL is part of the Open Foris Suite of Tools. The platform allows users to query and process satellite data quickly and efficiently, tailor their products for local needs, and produce sophisticated and relevant geospatial analyses.
Type: Meteorological and Hydrological
Food and Agriculture Organization of the United Nations (FAO)
Search: FAO Global Forest Resources Assessment (FRA)
Search: Food and Agriculture Organization of the United Nations (FAO)
Type: Hazard; Exposure; Vulnerability
FAO Global Forest Resources Assessment (FRA) provides essential information for understanding the extent of forest resources, their condition, management and uses. FAO has been monitoring the world’s forests at 5 to 10 year intervals since 1946. The Global Forest Resources assessments (FRA) are now produced every five years in an attempt to provide a consistent approach to describing the world’s forests and how they are changing. The Assessment is based on two primary sources of data: Country Reports prepared by National Correspondents and remote sensing that is conducted by FAO together with national focal points and regional partners. The scope of the FRA has changed regularly since the first assessment was published in 1948. These assessments make an interesting history of global forest interests, both in terms of their substantive content, but also in their changing scope.
Type: Environmental
Cluster: Environmental Degradation
Food and Agriculture Organization of the United Nations (FAO)
Search: WaPOR - FAO portal to monitor Water Productivity through Open access of remotely sensed derived data
Search: Food and Agriculture Organization of the United Nations (FAO)
Type: Exposure; Vulnerability
The FAO has developed a publicly accessible near real time database using satellite data that allows the monitoring of agricultural water productivity at different scales. The WaPOR project aims to assist partner countries in developing their capacity to monitor and improve water and land productivity in agriculture, both rainfed and irrigated, responding therefore to the challenges that are posed by the dwindling of freshwater resources and the need to sustain agricultural production to ensure food security in the face of a changing climate. The WaPOR database and portal provides open access to near-real time information on key land and water variables.
IHE Delft Institute for Water Education
Search: Coastal Futures viewer
Search: IHE Delft Institute for Water Education
Type: Hazard; Exposure; Loss; Vulnerability
A one stop viewer for 21st century projections of climatic impact-drivers (CIDs) leading to coastal impacts and risk (including coastal CID data sets assessed in IPCC AR6 WGI)
Type: Environmental
Cluster: Environmental Degradation
Hazard: Multi-hazard
National Aeronautics and Space Administration (NASA)
Search: Earth Observing System Data and Information System (EOSDIS) Worldview
Search: National Aeronautics and Space Administration (NASA)
Type: Hazard; Exposure; Loss; Vulnerability
This open source code app from NASA's EOSDIS provides the capability to interactively browse over 1000 global, full-resolution satellite imagery layers and then download the underlying data. Many of the imagery layers are updated daily and are available within three hours of observation - essentially showing the entire Earth as it looks "right now". This supports time-critical application areas such as wildfire management, air quality measurements, and flood monitoring. Arctic and Antarctic views of many products are also available for a "full globe" perspective. Geostationary imagery layers are also now available. These are provided in ten minute increments for the last 90 days. These full disk hemispheric views allow for almost real-time viewing of changes occurring around most of the world. Browsing on tablet and smartphone devices is generally supported for mobile access to the imagery.
Hazard: Multi-hazard
National Aeronautics and Space Administration (NASA)
Search: EarthData: Open access for open science
Search: National Aeronautics and Space Administration (NASA)
Type: Hazard; Exposure; Loss; Vulnerability
NASA’s Earthdata website is your gateway to one of the planet’s largest repositories of Earth observation data. These data – along with the tools for analyzing and working with these data – are available to you fully, openly, and without restriction.
Hazard: Multi-hazard
National Oceanic and Atmospheric Administration (NOAA). National Centers for Environmental Information (NCEI)
Search: Global Climate Station Summaries
Search: National Oceanic and Atmospheric Administration (NOAA). National Centers for Environmental Information (NCEI)
Type: Exposure; Hazard
The Global Climate Station Summaries are simple indicators of observational averages which include climatic data summarizations and frequency distributions. These typically are statistical analyses of station data over 5-, 10-, 20-, 30-year or longer time periods or for customized periods. Summaries for the following weather elements are available: Ceiling-visibility, dew point statistics, flying conditions, relative humidity, sky cover, sea-level pressure, station pressure, temperature, wind speed / direction, and present weather. Data were derived from stations observing global hourly data.
Type: Meteorological and Hydrological
Hazard: Multi-hazard
National Oceanic and Atmospheric Administration (NOAA). National Centers for Environmental Information (NCEI)
Search: Global Forecast System (GFS) [NCEI NOAA]
Search: National Oceanic and Atmospheric Administration (NOAA). National Centers for Environmental Information (NCEI)
Type: Exposure; Hazard
The Global Forecast System (GFS) is a National Centers for Environmental Prediction (NCEP) weather forecast model that generates data for dozens of atmospheric and land-soil variables, including temperatures, winds, precipitation, soil moisture, and atmospheric ozone concentration. The system couples four separate models (atmosphere, ocean model, land/soil model, and sea ice) that work together to accurately depict weather conditions. See also Global Forecast System (GFS) [EMC NCEP NOAA]
Hazard: Multi-hazard
National Oceanic and Atmospheric Administration (NOAA). National Centers for Environmental Information (NCEI)
Search: Global Historical Climatology Network daily (GHCNd)
Search: National Oceanic and Atmospheric Administration (NOAA). National Centers for Environmental Information (NCEI)
Type: Exposure; Hazard
The Global Historical Climatology Network daily (GHCNd) is an integrated database of daily climate summaries from land surface stations across the globe. GHCNd is made up of daily climate records from numerous sources that have been integrated and subjected to a common suite of quality assurance reviews. GHCNd contains records from more than 100,000 stations in 180 countries and territories. NCEI provides numerous daily variables, including maximum and minimum temperature, total daily precipitation, snowfall, and snow depth. About half the stations only report precipitation. Both record length and period of record vary by station and cover intervals ranging from less than a year to more than 175 years.
Hazard: Multi-hazard
Swedish Meteorological and Hydrological Institute (SMHI). Coordinated Regional Climate Downscaling Experiment (CORDEX)
Search: WCRP CORDEX [World Climate Research Programme - Coordinated Regional Climate Downscaling Experiment]
Search: Swedish Meteorological and Hydrological Institute (SMHI). Coordinated Regional Climate Downscaling Experiment (CORDEX)
Type: Exposure; Hazard
An initial focus of the CORDEX initiative was to establish a central CORDEX archive supplemented by regional data portals. However, it soon became clear that a geographically distributed archiving system such as the Earth System Grid Federation (ESGF) would offer much greater flexibility for the provision of numerous CORDEX RCM simulations produced by many modelling groups across the globe, analogous to the Coupled Model Intercomparison Project Phase 5 (CMIP5).
Hazard: Multi-hazard
UK Space Agency
Search: Modelling Exposure Through Earth Observation Routines (METEOR)
Search: UK Space Agency
Type: Exposure
Download Level 1 exposure data in CSV format with OED codes. Copyright (C) 2020 ImageCat Inc. and METEOR Project Consortium. This data was developed as part of the Modelling Exposure Through Earth Observation Routines (METEOR) project and is a Level 1, or a global-quality exposure data set. Minimal country-specific data was collected with a specific focus on the countries of Nepal and Tanzania. The data is intended for CAT modeling and loss estimation. Repurposing this data for any reason other than assessing risk is not recommended. The data presents the estimated number of buildings, building area, and rebuilding value at a 15-arcsecond grid resolution (approximately 500 meters at the equator). This data set is in point shapefile format where the points represent the centroids of the 15-arcsecond grid.
United Nations Conference on Trade and Development (UNCTAD)
Search: UNCTADstat [United Nations Conference on Trade and Development]
Search: United Nations Conference on Trade and Development (UNCTAD)
Type: Exposure; Vulnerability
UNCTADstat gives access to more than 150 indicators and statistical time series for almost all economies of the world.
United Nations High Commissioner for Refugees (UNHCR)
Search: Microdata Library [United Nations High Commissioner for Refugees (UNHCR)]
Search: United Nations High Commissioner for Refugees (UNHCR)
Type: Exposure; Vulnerability
UNHCR's Microdata Library contains microdata on forcibly displaced and stateless people. Microdata are unit-level data collected through census, registration/administrative exercises and surveys. All datasets include comprehensive metadata and supporting documents such as survey questionnaires and analytical reports.
United Nations Population Fund (UNFPA)
Search: Data Portal [United Nations Population Fund (UNFPA)]
Search: United Nations Population Fund (UNFPA)
Type: Exposure; Vulnerability
Data on population, gender equality and sexual and reproductive health.
United Nations Statistics Division (UNSD)
Search: United Nations (UN) Disability Statistics (DISTAT)
Search: United Nations Statistics Division (UNSD)
Type: Exposure; Vulnerability
The United Nations Statistics Division maintains a comprehensive international repository on disability statistics, which was first published in 1988 and known as the United Nations Disability Statistics Database (DISTAT). The repository contains data and metadata on disability from official statistics compiled from national population and housing censuses, household surveys, and some administrative data.
United Nations Statistics Division (UNSD)
Search: UN Data [United Nations]
Search: United Nations Statistics Division (UNSD)
Type: Exposure; Vulnerability
UN data is an internet-based data service which brings UN statistical databases within easy reach of users through a single entry point (http://data.un.org/) from which users can now search and download a variety of statistical resources of the UN System.
University of New South Wales
Search: Climpact: Quickly calculate climate indices using your own weather and climate data
Search: University of New South Wales
Type: Exposure; Hazard
Use Climpact to quickly analyse climate extremes using your own weather or climate data. The Climpact open source package for R reads in meteorological data (daily minimum and maximum temperatures, as well as daily precipitation) and delivers the frequency, duration and magnitude of various climate extremes that are directly relevant to each sector. Indices calculated by Climpact are available at both monthly and annual timescales.
Type: Meteorological and Hydrological
Hazard: Multi-hazard
University of Oxford. Oxford Programme for Sustainable Infrastructure Systems
Search: Global Climate-Related Risk Analytics (GRI Risk Viewer, previously called the Global Systemic Risk Assessment Tool (G-SRAT))
Search: University of Oxford. Oxford Programme for Sustainable Infrastructure Systems
Type: Hazard; Exposure; Vulnerability
A data and analytics portal covering hazards, exposure, vulnerability and risk to infrastructure and people around the world. This tool aims to support climate adaptation decision-making by identifying spatial vulnerabilities and risks under current and future climate scenarios.
Hazard: Multi-hazard
World Bank
Search: Climate Change Knowledge Portal (CCKP)
Search: World Bank
Type: Hazard; Loss; Vulnerability
The Climate Change Knowledge Portal (CCKP) provides global data on historical and future climate, vulnerabilities, and impacts. Explore them via Country and Watershed views. Access synthesized Country Profiles to gain deeper insights into climate risks and adaptation actions.
Type: Meteorological and Hydrological
Hazard: Multi-hazard
Sample of tools: Global risk data in action
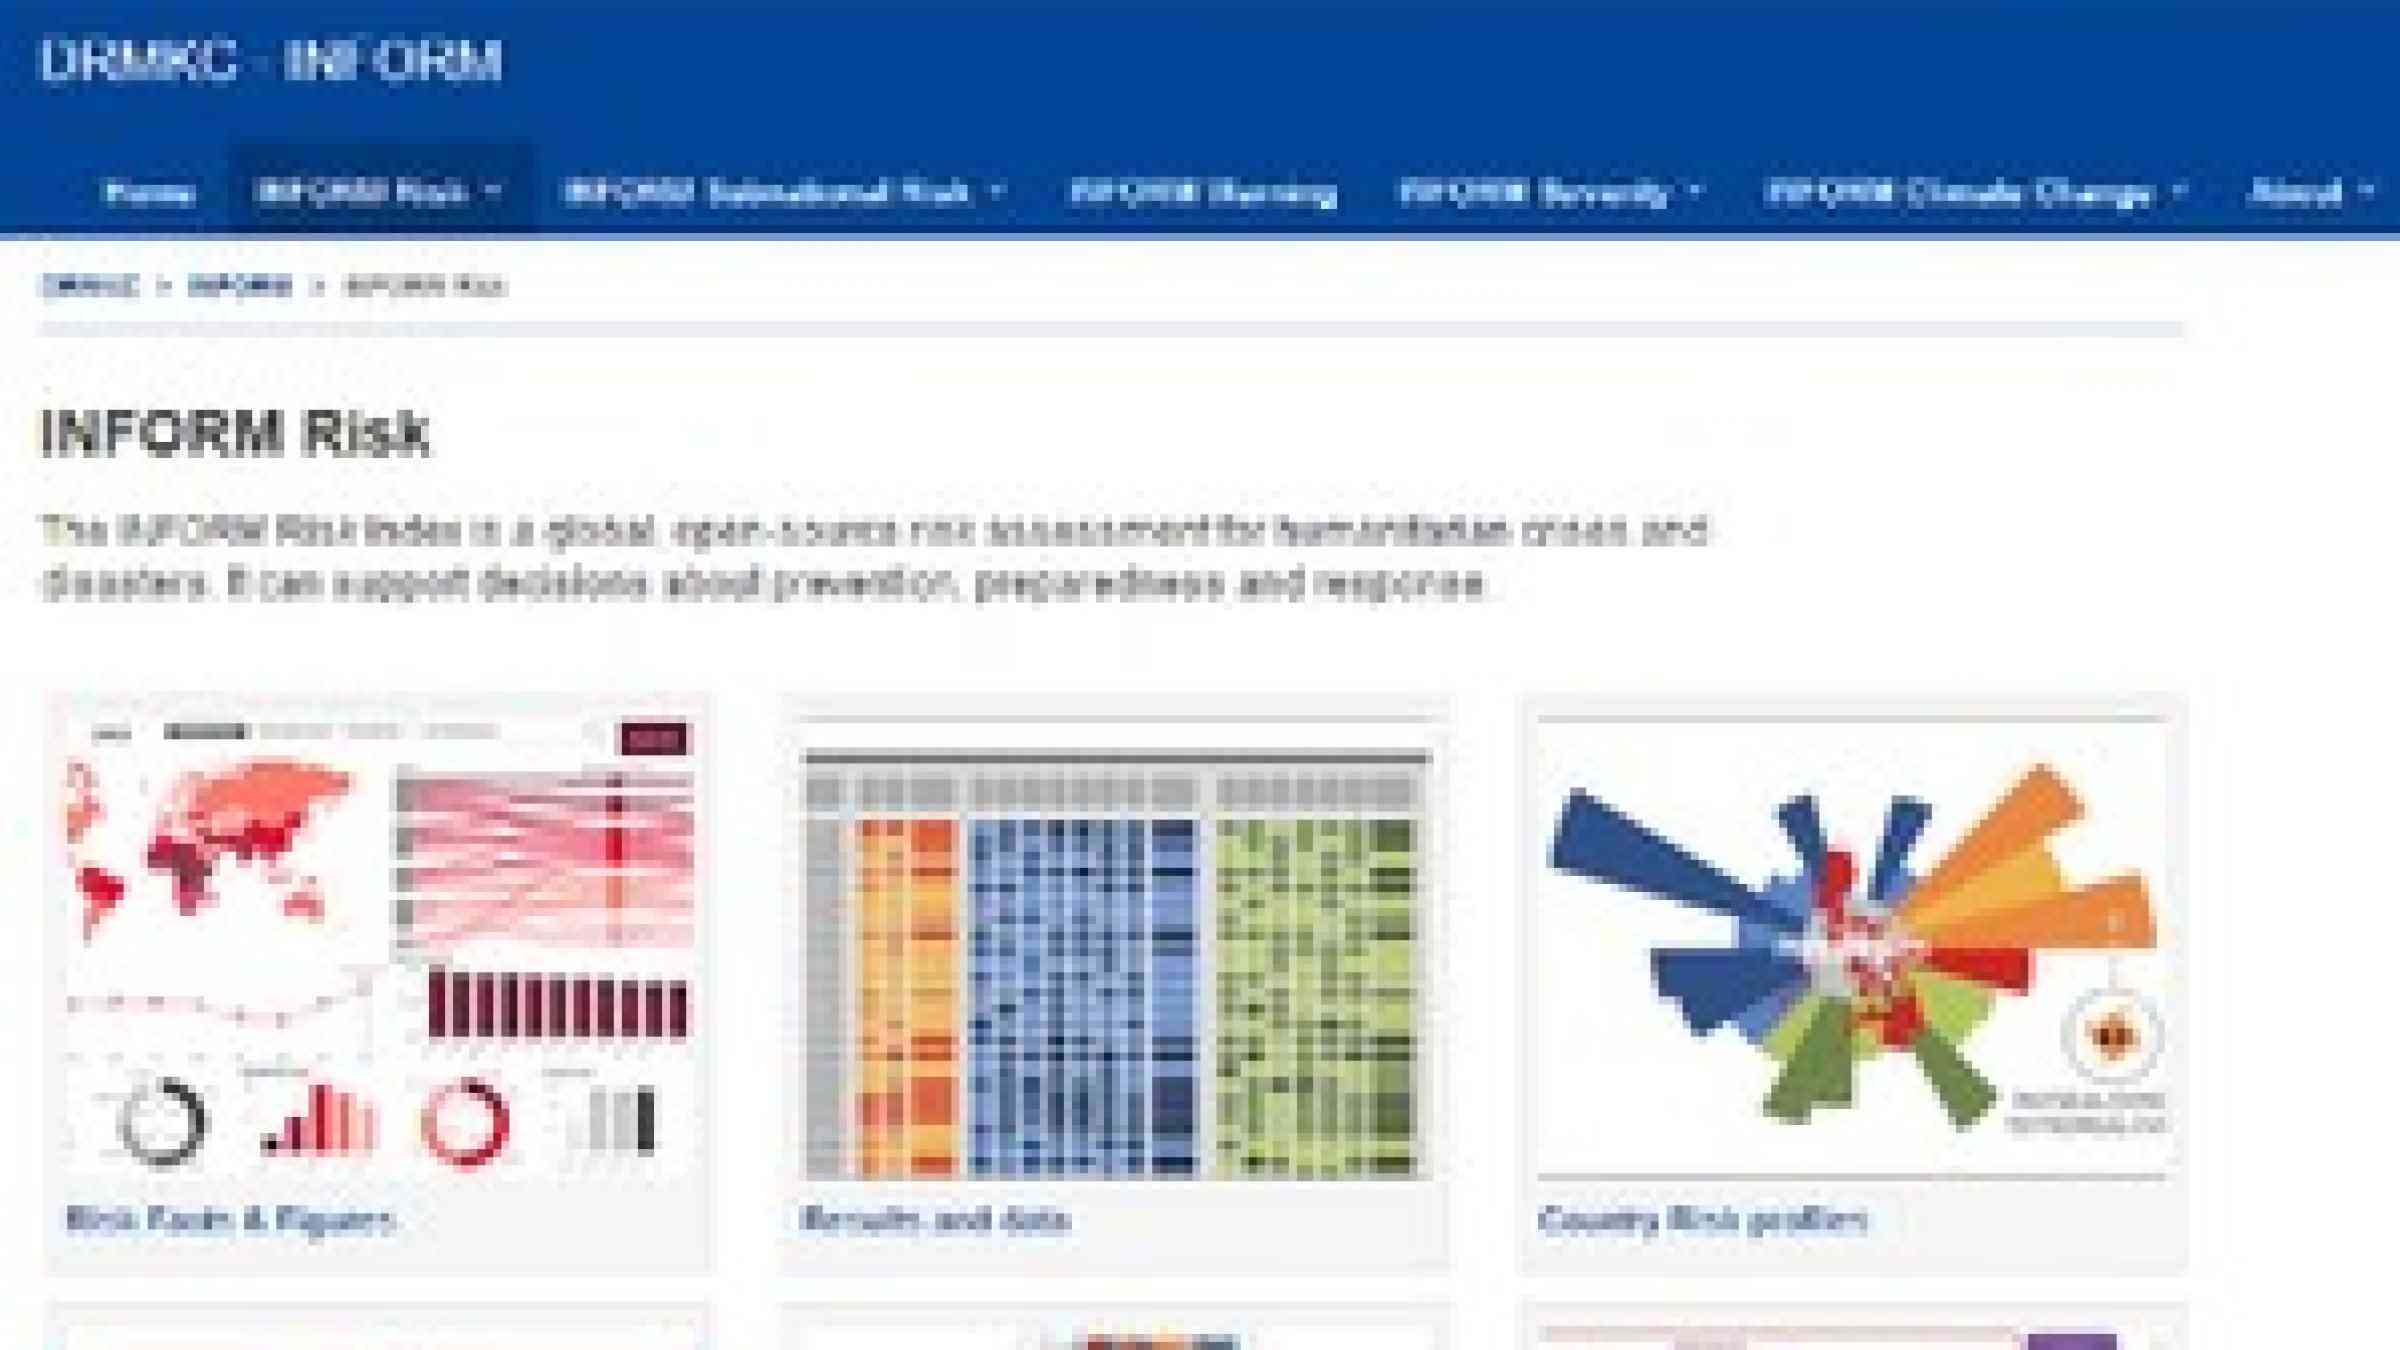
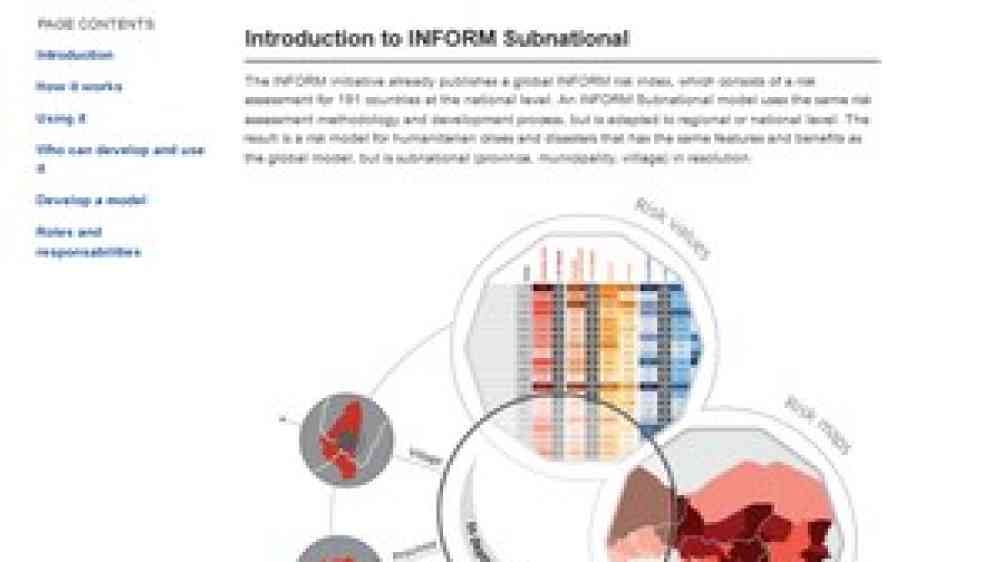
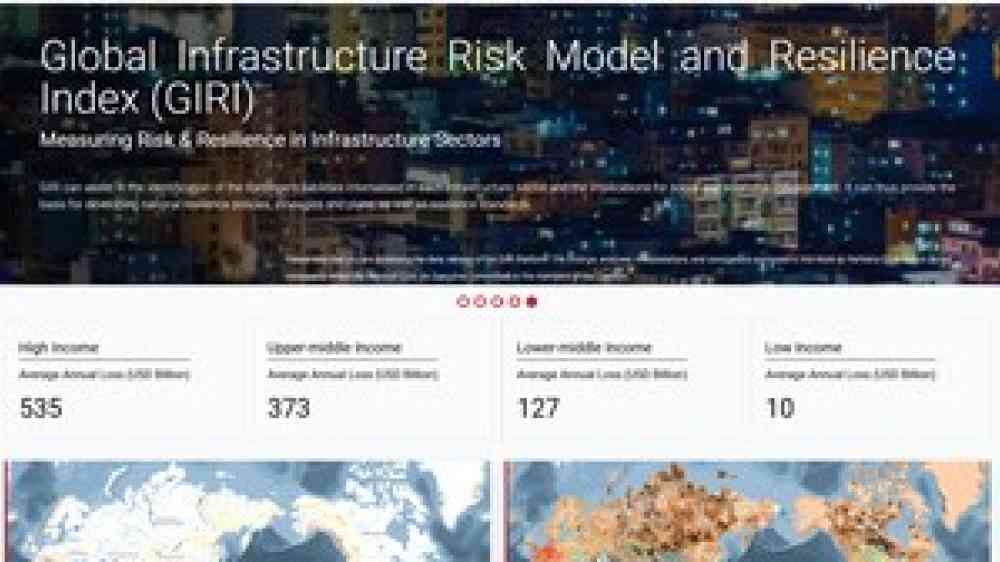
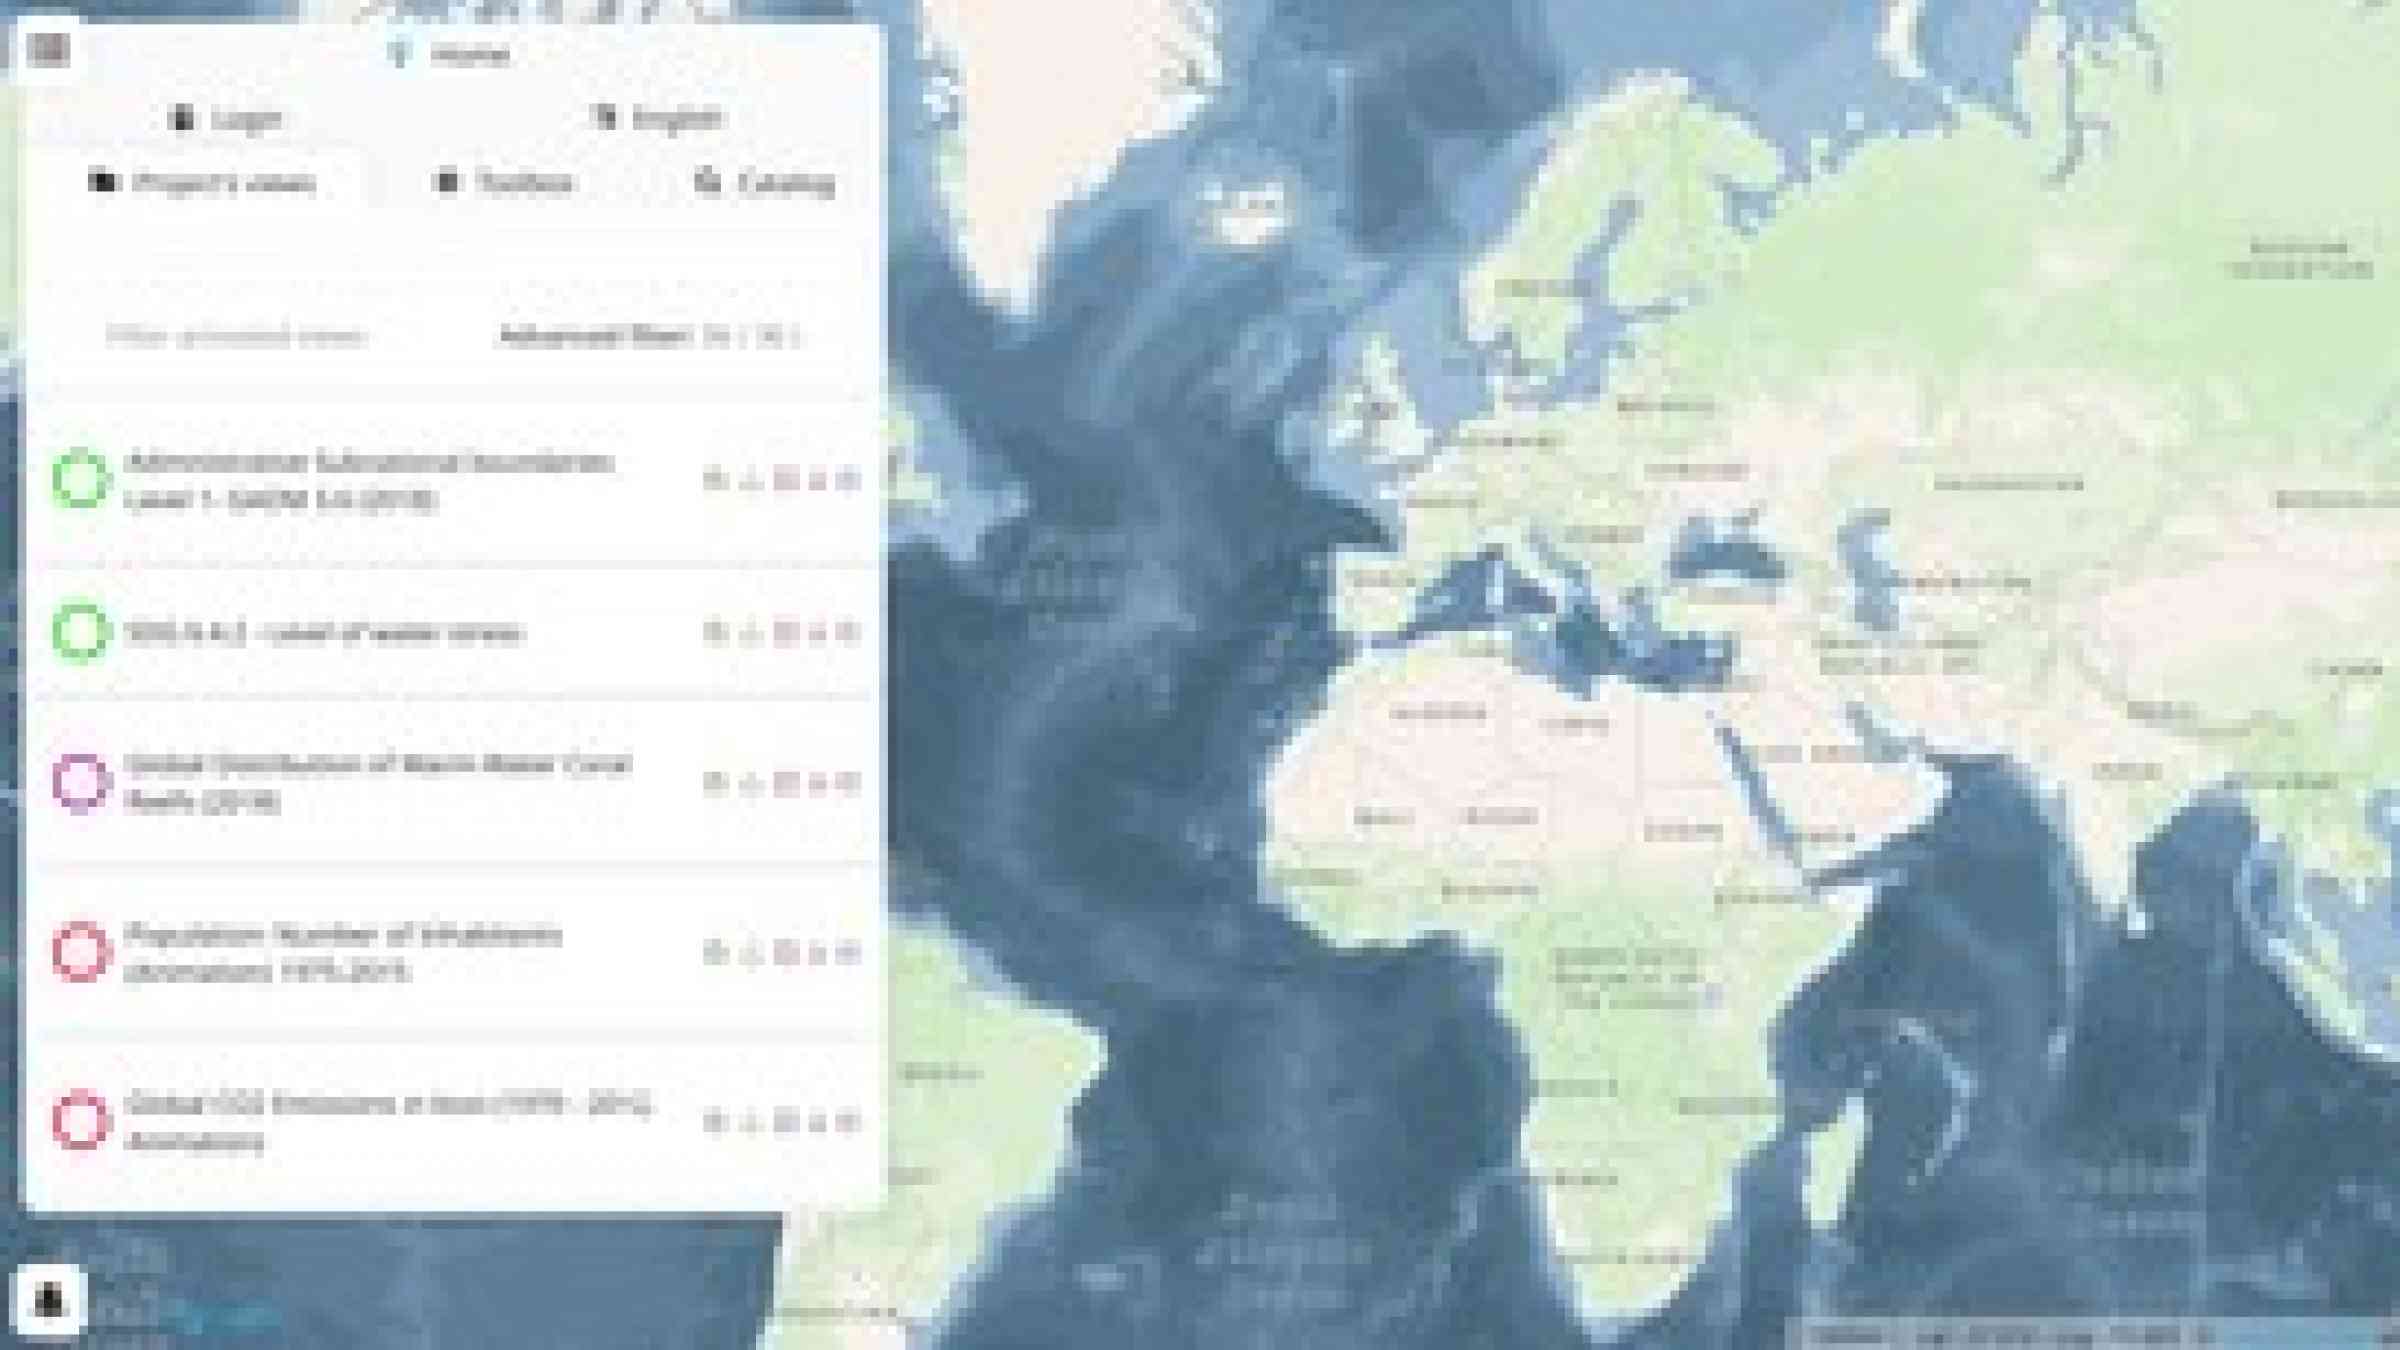
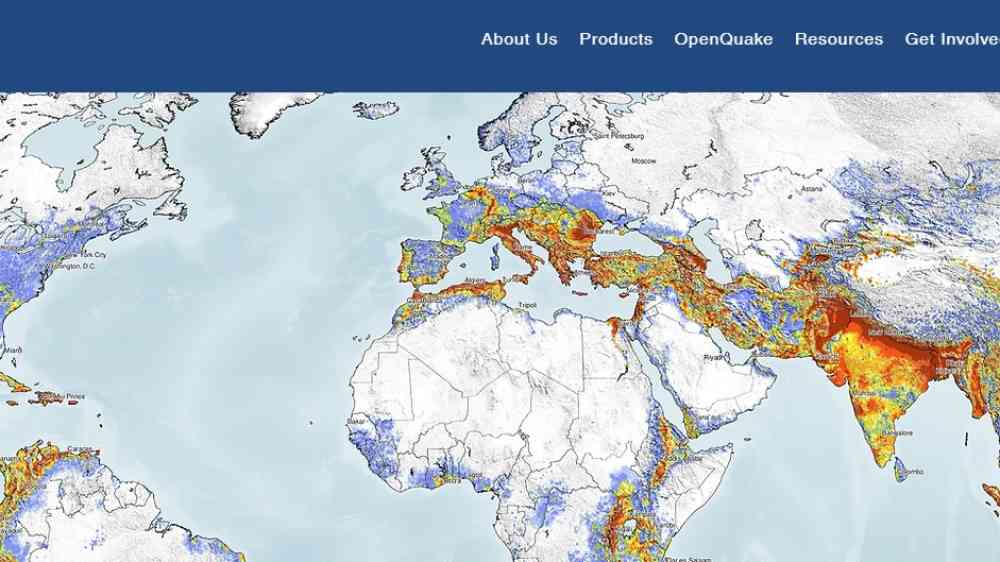
Other global GEM initiatives include OpenQuake Map Viewer - Global Exposure Map, OpenQuake Map Viewer - Global Building Exposure 2023, and the Global Economic Vulnerability Map.

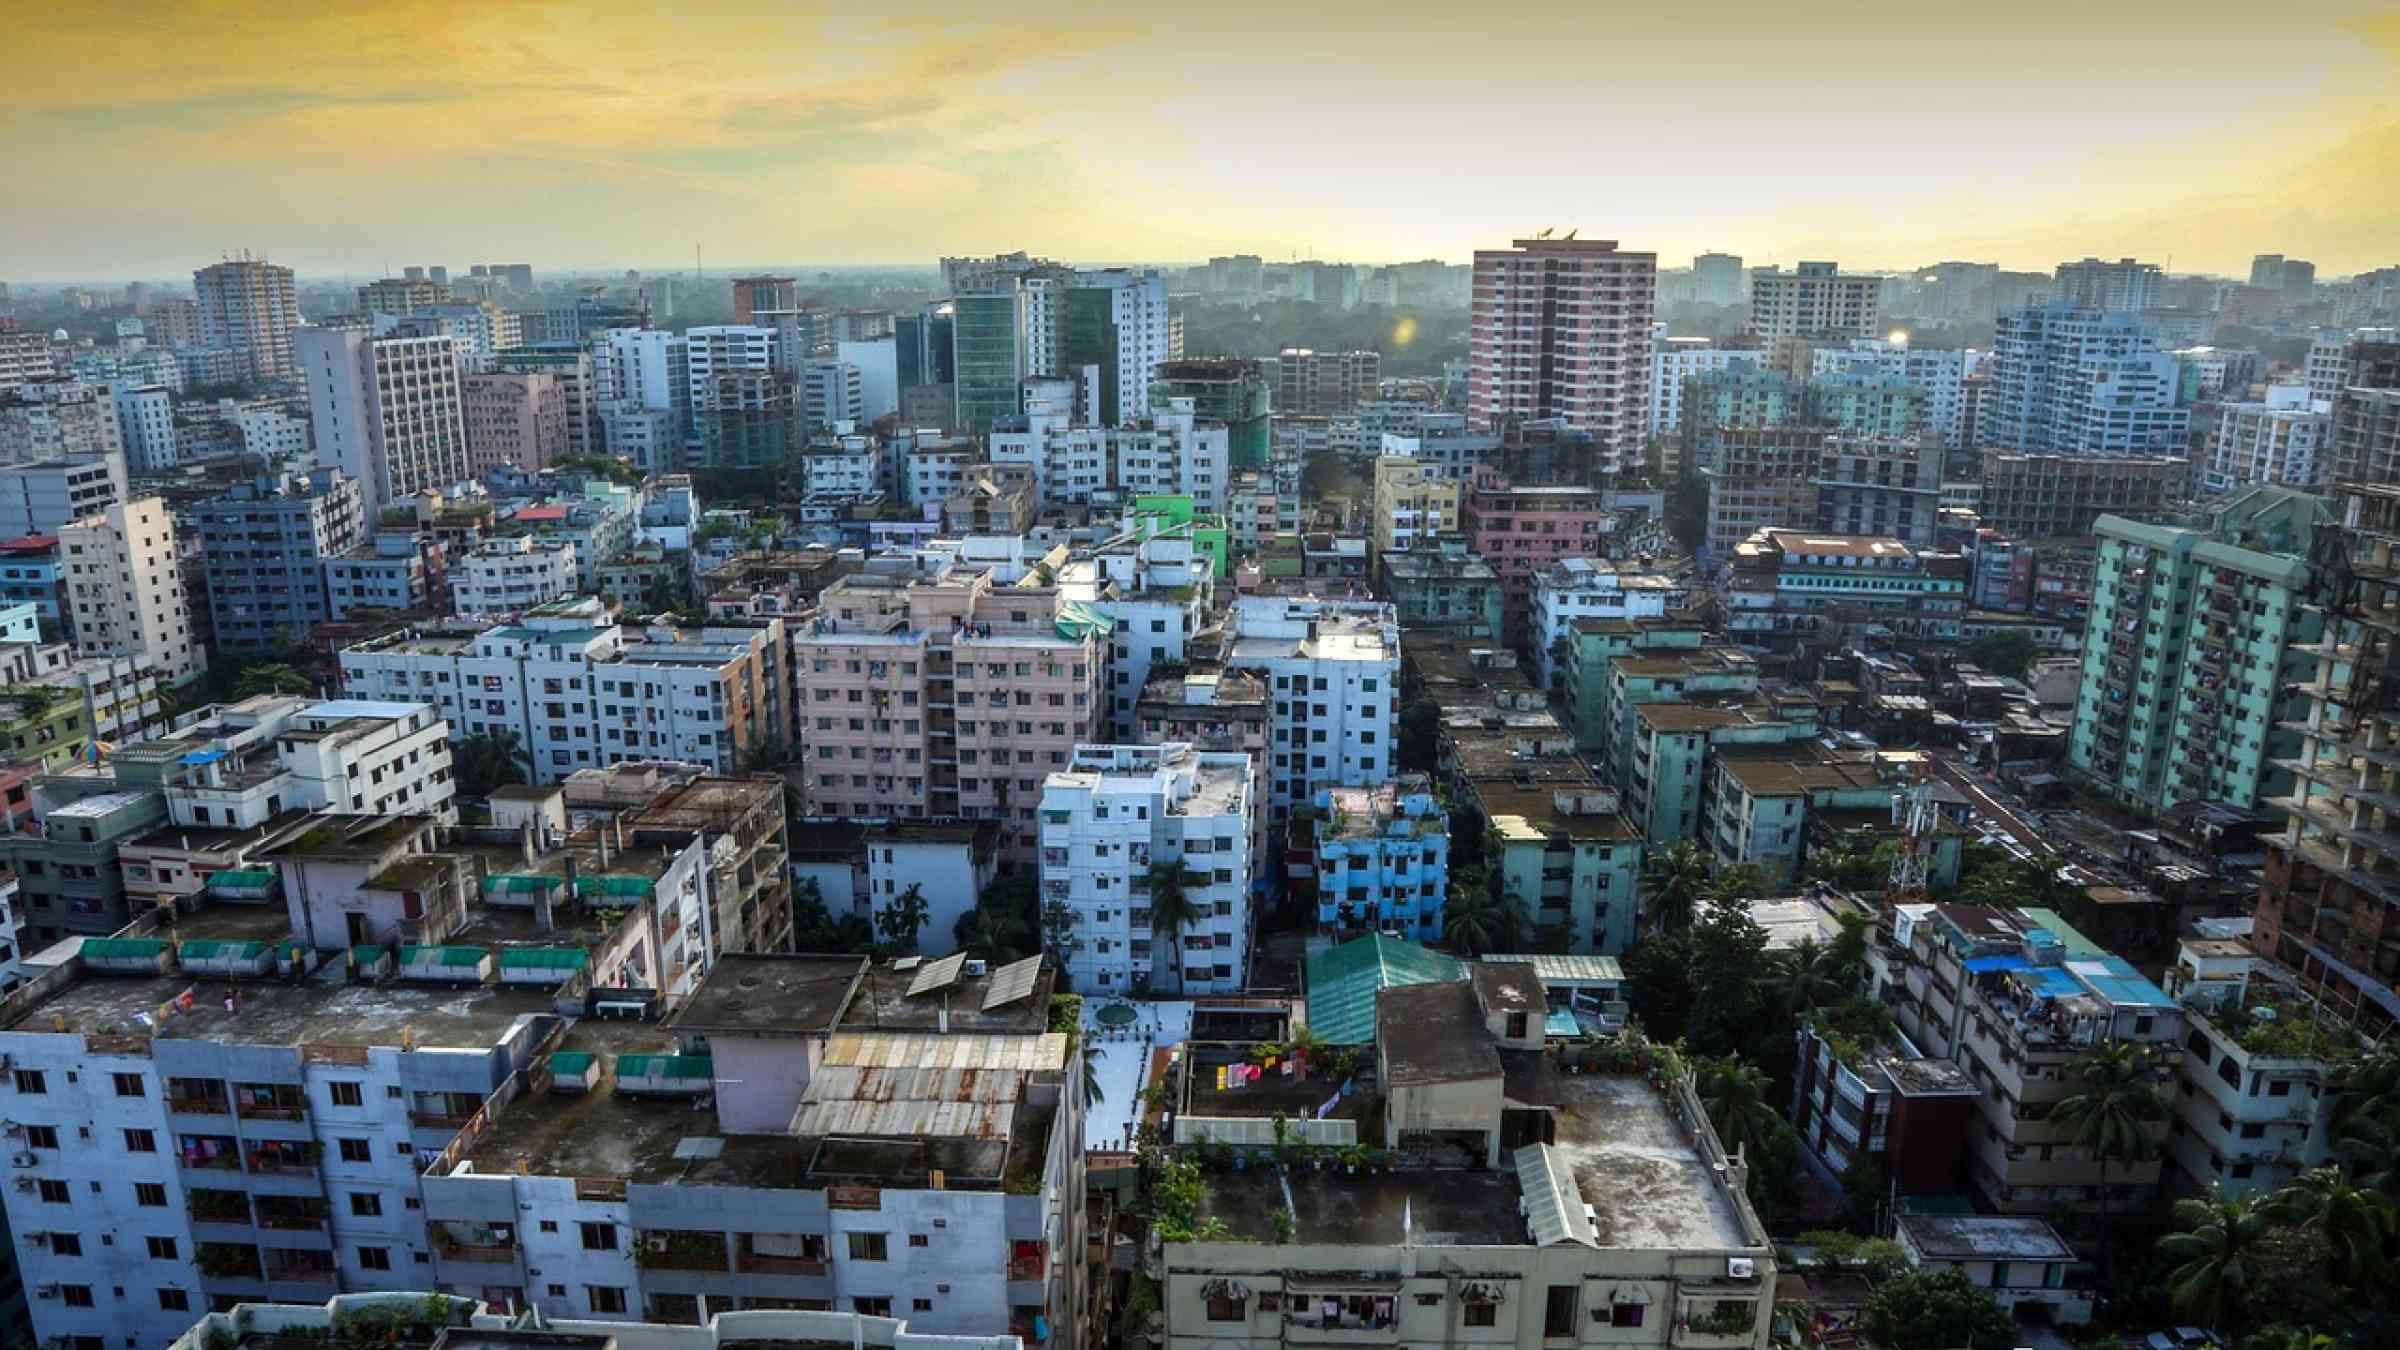
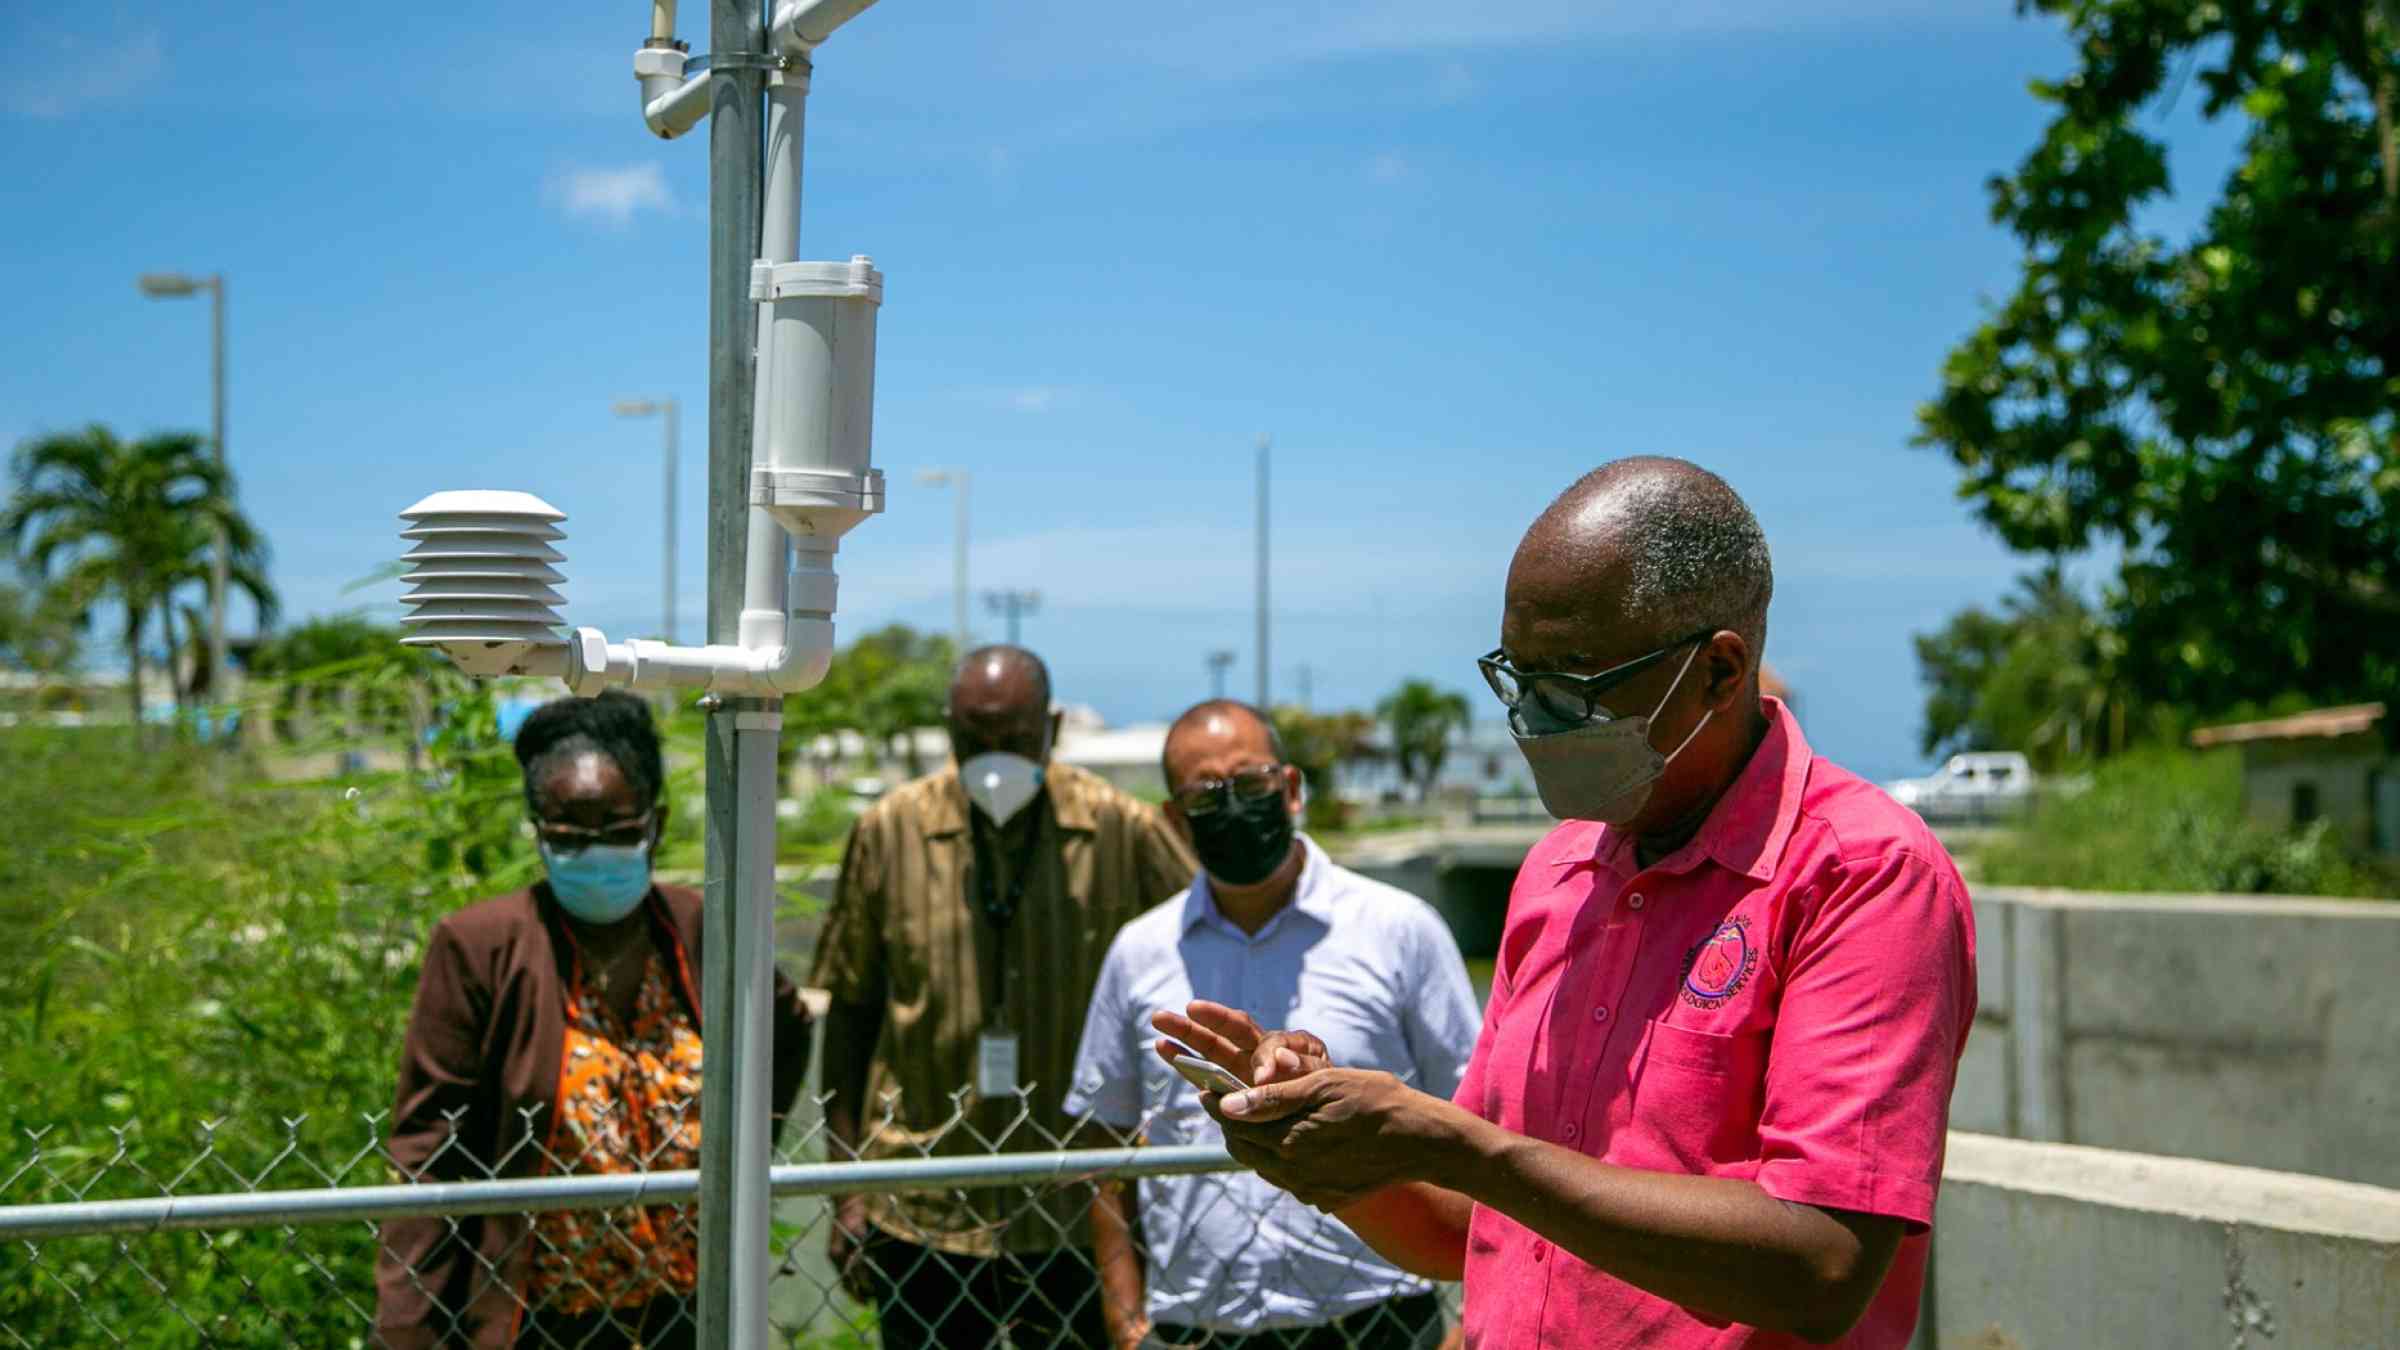
Learn more about Risk